


Introduction
In the late twentieth century, the growing influence of a drying climate on rainfall and streamflow and its effect on the reliability of surface water resources in the south-west of Western Australia, dominated debate in water policy. Reduced winter rainfalls of 15–25% (Smith and Power 2014; Alilou et al. 2022) were largely attributed to changes in atmospheric circulation (Indian Ocean Climate Initiative and Western Australia 2002; Bates et al. 2008; Grose et al. 2020), the position of the Indian Ocean high pressure ridge (Rehman and Iqbal 2011), and to some degree, the influence of anthropogenic forcing (Nair et al. 2011). Notwithstanding the cause, the onset of hotter and drier climatic conditions has fundamentally changed hydrologic processes (McFarlane et al. 2020; Priestley et al. 2023) and motivated the adoption of climate resilient options such as desalination of seawater, increased water use efficiency measures and reliance on groundwater in some areas.
This was not the paradigm of the 1900s, when the policy of building reservoirs for potable water and irrigation was supported by purposefully logging (for timber) or clearing forests (for agriculture). However, while these land use changes initially increased supply, they also caused salinisation of reservoirs and farmlands (Wood 1924). Demands for resource protection led to enactment of the Western Australian Rights in Water and Irrigation Act of 1914 and the Forests Act of 1918, primarily for public water supply catchments (Bennett and McPherson 2000; McCaw et al. 2018). This period of development coincided with the region’s wettest recorded decades (1920–1960s) (Hughes and Wang 2022), and until the 1990s, was underpinned by active hydrologic research in both forested and cleared catchments.
Coordinated research revealed that clearing forests for agriculture increased recharge, which then raised watertables (aquifer storage) and increased streamflow. Consequentially, entrained stored salts were released into streams and salinity rose by orders of magnitude (Peck and Williamson 1987). Following the publication of these studies, clearing bans were established in key water resource areas and many research catchments were abandoned, especially in the south-west. Those catchment experiments included the seminal salinity experiments (1973–1987) in the Wellington Dam catchment (Peck and Williamson 1987) and the Woodchip License Area research catchments (1975-1987) of the Southern Forest (Borg et al. 1987a, 1987b).
Seeking to explain recent accelerated drying and diminished streamflow, researchers returned to the northern Darling Range experimental catchments, including several catchments subject to bauxite mining. Petrone et al. (2010) analysed rainfall and runoff data and found that streamflow had reduced by ~70% (1950–2008). Notably they found that streamflow continued to decline (1989–2008) when there had not been a commensurate reduction in rainfall, and proposed mechanisms due to reduced watertables to be responsible. Hughes et al. (2012) demonstrated that when groundwater levels in forested catchments fell (measured at rates between 0.08 – 0.48 m/yr after 1975), below a critical depth of 3 m in the riparian zone, streamflow either ceased, or reduced. Kinal and Stoneman (2012) and Hughes et al. (2012) determined that ‘non-stationarity’ had been caused by the disconnection of deeply-weathered groundwater, primarily within the riparian zone, fundamentally changing the relationship between catchment groundwater storage and streamflow.
In response to empirical studies (Petrone et al. 2010; Kinal and Stoneman 2011; Hughes et al. 2012), and modelling (Grigg and Hughes 2018), Hughes et al. (2021) and Fowler et al. (2020) revisited commonly used rainfall-runoff models and their ability to predict future streamflow. Significant from these reviews was the emergent issue of over-prediction of streamflow implicit in industry standard ‘rainfall-runoff’ models. By developing updated code, Hughes et al. (2021) improved industry capability to model a drying climate, when tested on catchments in the Darling Ranges and 137 catchments in eastern Australia.
McFarlane et al. (2020) broadened the analysis of changes in the hydrology of the south-west and discussed the impact of non-stationarity in both cleared and forested catchments. In addition to the rapid drying of forests and loss of streamflow, they observed the effects of non-stationarity due to clearing 17 Mha of forest and woodland for conversion to farmlands. Here the opposite (wetting) effect became apparent when watertables rose (up to 30 m in high rainfall areas) to the soil surface, inducing extensive growth of areas with shallow (< 2 m) watertables. In response, up to 1.75 Mha of agricultural land (Caccetta et al. 2022) has become periodically saturated and/or saline. Excess water is thus generated from cleared landscapes, in contrast with the effect of drying observed in the forested catchments.
Critical to the region, this paper reports the results of a multidecadal analysis of watertable changes in forested catchments. It discusses the importance of non-stationarity in understanding observed and forecast streamflow and looks at factors that may affect the future availability of water for agriculture and the environment.
Methods
Study area
The Southern Forest catchments described in this paper refer to lands south of the Blackwood River within the Warren-Donnelly region (Fig. 1). Much of the area is on the south-western edge of the Darling Plateau and is underlain by Archaean and Proterozoic rocks of the Yilgarn craton (Churchward 1992). A series of rivers drain to the Southern Ocean, the largest of these being the Warren and Donnelly Rivers and their tributaries. The area is characterised by extensive tracts of native vegetation, managed as National Parks, State Forests (logged for timber until 2023) or in designated conservation reserves, much of it relatively remote and containing the last wild rivers of the south-west. A variety of extensive grazing and intensive irrigated horticulture take place on cleared land (<15% of the area) which is concentrated around the population centres of Manjimup, Pemberton and Northcliffe.
_in_the_southern_forest_region_of_wester.jpg)
The Southern Forest region has a temperate climate with dry, warm summers and rainfall that is concentrated in the cooler months of the year (Peel et al. 2007). Long-term annual rainfall in this region is typically >1200 mm, although there is a steep gradient from wetter areas near the coast (1400 mm) to lower rainfall catchments inland with 800 mm per year.
Climate analyses
Rainfall
Rain gauges in the Southern Forest with longer-term records (Fig. 1) include Manjimup (1916-present), Wilgarrup (1907-present), Pemberton (1941-present) and Biddelia (1900-1970). Manjimup, Wilgarrup and Pemberton are defined by the Australian Bureau of Meteorology as high-quality network gauges (Marinelli et al. 2012). The Biddelia gauge has been included in the analysis, despite closing in 1971, to reflect historic data near the main Donnelly flow gauge at Strickland. Student’s t-tests were performed on data for these gauges to test the validity of the assumption that apparent differences of annual totals between periods are indicative of declining trends, rather than high interannual variability within and between periods. Proportional changes in streamflow and rainfall, with respect to the period (1952-1974) were calculated. Changes in groundwater levels were not compared in this way because of the long gaps in the data records.
Changes in the frequency of daily rainfall totals between the three periods considered above were also investigated using categorised histograms for the Pemberton, Manjimup and Wilgarrup gauges. Daily totals were chosen as a surrogate for rainfall event analysis that would require sub-daily rainfall data.
Maximum temperature
Maximum daily temperature data for Manjimup and Pemberton, as a driver of changes in atmospheric water demand, were examined for long-term trends. Reliable data were available from 1957 to 2024. Statistical trends in mean daily maximum temperatures, by month, were determined using the non-parametric Mann-Kendall trend test, with p-values calculated using the algorithm of Best and Gipps (1974). Calculations were performed in R software using the “Kendall” package (available at http://CRAN.R-project.org/package=Kendall). The analyses performed included a test for autocorrelation in mean daily maximum temperature.
Groundwater analyses
Experimental catchments were established in response to a 1973 Environmental Impact Statement into the export of woodchips from logging operations in the Southern Forest (Western Australian Forests Department in 1973). Research was overseen by the Steering Committee on Research into the effects of the woodchip industry on water resources in south-western Australia (co-ordinated by the Water Authority of Western Australia in 1987). Catchments were chosen to represent the principal forest and soil types and span the rainfall gradient across the woodchip licence area. Catchments were assigned to one of three rainfall zones based on long term annual rainfall from 1926–1976 (Loh and King (1978), namely higher rainfall (>1100 mm/yr), intermediate rainfall (900–1100 mm/yr) and lower rainfall (< 900 mm/yr).
Initial studies focused on four harvest coupes logged for sawlogs and chiplogs in 1976–78 (Table 1). Weirs and monitoring bores were constructed prior to logging, including control bores in adjacent forest (Borg et al. 1987b). These relatively large comparison catchments (a term used to differentiate the paired catchments) were logged and monitored to assess changes in streamflow, salinity, sediment and watertables. Coupes at Poole and Crowea were in karri-dominant forest in the highest rainfall zone and were clearfelled (Fig. 2), while Iffley (high rainfall) and Mooralup (lower rainfall) were in jarrah-dominant forest and subject to heavy selection cutting. Logged coupes were burnt in 1978–79 to remove debris and promote regeneration. Iffley was regenerated naturally from seedfall and existing ground coppice, while Poole and Crowea were hand-planted with karri seedlings (Borg et al. 1987b).
In 1976, three sets of paired experimental catchments (90–260 ha) were initiated at Yerraminnup (low rainfall), April and March Roads (intermediate rainfall) and Lewin (high rainfall) catchments (Martin 1986; Borg et al. 1987a; Bari & Boyd 1993; Bari et al. 1996). One catchment of each pair was logged (1982–1983) after six years of baseline monitoring. Monitoring continued regularly until between 1993 and 1998 (Table 1) when it ceased. The April Road North catchment retained a 200 m wide vegetated buffer, occupying all of the stream zone, while the nearby March Road catchment was clear-felled without a stream buffer (Bari et al. 1996).
_and_post-clearfell_(b)_at_crowea_catchment_bore_20_(60718501)._source__l.png)
Most monitoring bores were installed by auger drilling by the Geological Survey of Western Australia, with some wire-line coring undertaken to access bedrock, enable aquifer tests and monitor changes in soil water (Martin 1986; Borg et al. 1987a, 1987b). PVC casing (38 mm internal diameter) was inserted and fully slotted to within 2 m of the soil surface, gravel-packed and the upper annulus and steel collar pipe, cemented. Martin (1986) reports deep bores were targeted near the interface with fresh-rock (auger rig refusal or wire-line penetration of basement gneissic rocks), with fewer shallow bores (<4 m) installed into perched-seasonal aquifers. Drill completion reports summarised the deeply weathered regolith profile, which typically consists of leached silt, clay and sand-size material, of 5-30 m thickness, overlying basement rock (Martin 1986). Groundwater salinity was recorded in bores. Stream gauges were installed at all catchments. No streamflow gauges were operating, nor were groundwater salinity measurements collected when this study commenced in 2021.
Selection of bores for analysis
Water levels in catchment bores were monitored monthly until about 1986 in the comparison catchments in the initial years of the Woodchip project (Borg et al. 1987b) and until approximately 1993–98 for the paired catchments (Borg et al. 1987a; Bari et al. 1996) and then abandoned. Almost no further measurements were recorded in the catchments until 2010, when a condition audit was undertaken (Joe Kinal, 2014 pers comm, Department of Biodiversity Conservation and Attractions, DBCA) and 2016, when catchment bores were sporadically monitored.
In 2021, we relocated bores using updated coordinates, and commenced monitoring, including collating unpublished data into a database. Site access was difficult given tracks created in the 1970s had either been destroyed by forest operations or were overgrown. Many bores have been lost to fires or fallen debris.
Of a total of 180 bores re-assessed in 2021, we found and/or repaired 62 bores to a working condition suitable for analysis. Over 118 bores were omitted from this study because they were dry or blocked (74%), damaged (5%) or lost (2%). The remaining 19% of bores were excluded from the analysis either because the dataset was incomplete (no recent measurements post-2000) or because a bore and its data was deemed unreliable. A bore was classified as “unreliable” if it was dry, had a shallow saturated thickness when installed (including if the bore was installed to monitor the perched aquifer), or if the bore was seasonally dry. In three instances, hillslope bores in Lewin North were excluded because it appeared there was leakage from the perched aquifer, which was evident in annual amplitudes that were at least twice that of other hillslope bores. No bores were usable in Mooralup catchment. In the lower-rainfall Yerraminnup catchments, only 5 of the original 48 bores had watertables (most were dry) (Table 1).
Detecting water level change
For the 62 functioning bores with data spanning up to 49 years, the frequency of observations varied from over 200 (paired catchments) to less than 20 records per bore (comparison catchments). Only annual average values of groundwater depth were reported by Borg et al. (1987b) for the comparison catchments. Attempts to locate monthly data were unsuccessful. While plots in publications by Martin (1980) display more frequent data (1975-1980) for Iffley catchment, they could not be accurately transposed. For all catchments, only bores with sufficient initial data (multiple years of pre-treatment water levels) and multiple years of recent measurements, qualified as suitable for trend analysis.
Bores with a substantial saturated thickness were prioritised for analysis. Those not installed into the weathered regolith (namely, shallow bores with perched watertables), and those showing inconsistent seasonal level patterns (e.g. due to annulus flooding from perched aquifers that form in winter) were excluded. Most bores required regular removal of root materials and other blockages to enable access.
Water level trends for all bores were assessed using end-point analysis. Following the method of Borg et al. (1987a, 1987b) and Martin (1980, 1986), end-point analysis used dry season (autumn) water levels taken prior to treatment (logging). We compared those with similarly timed contemporary water levels. The analysis also compared the rate of change from the post-treatment peak (discussed by Borg et al. 1987a, 1987b and Martin 1986) to enable comparison of rates of recession between control and treatment catchments.
Estimates of changes in saturated zone storage were derived by analysing the response of water levels across the 1976-2024 monitoring period, relative to the depth of the saturated zone, and deriving a total change (watertable fall measured in metres). The initial saturated thickness value used in this analysis was tested against data reported by Martin (1986) and found to be comparable. Times estimated to deplete water in saturated zone (averaged for groups of bores classified as within the stream zone or hillslopes) were calculated based on the trend and depth of available storage. Results should be treated as indicative as such methods do not account for local bedrock-depth variability, changes in hydraulics (gradients for flow as watertables drop) and depth dependent tree-root dynamics.
Streamflow analyses
The Strickland flow gauge is located at the lower end of the Donnelly River catchment (1667 km2) and has been operated by Department of Water and Environmental Regulation (DWER) since January 1952. It was selected for analysis of streamflow change in relation to climate (rainfall and temperature) and watertables. The catchment includes both native vegetation and areas cleared for agricultural production. There are three other streamflow gauges upstream of Strickland (Chappells Bridge, Record Brook and Manjimup Brook), with shorter time-series records (HARC 2018).
Strickland streamflow data were analysed over three periods: 1952-74 (23 years), 1975-2000 (26 years) and 2001-24 (24 years). These intervals align with recognised climate windows reported in the literature (Petrone et al. 2010; McFarlane et al. 2020). We applied a moving block bootstrap (Kunsch 1989) separately within each analysis period. For each period, we resampled contiguous overlapping 5-year blocks (fixed block length, non-circular) to generate 10,000 replicate mean flows per period. Bootstrap confidence intervals on mean differences were used to test whether period means were significantly different (significant if zero was excluded at the 95%, 99% or 99.9% levels).
Results
Climate analyses
Rainfall
The 5-year moving average rainfall for the listed gauges is shown in Fig. 3. The figure shows an initial lower rainfall period, increasing from about 1910 to the mid-1920s and peaking in 1917. At most gauges, rainfall remained relatively high until the late 1940s. There was a later peak in annual rainfall in the mid-1960s, followed by a long drying trend. By contrast, at Biddelia annual rainfall fell abruptly from the mid-1920s until the late-1930s, it then peaked again in the mid-1960s in unison with the other stations, though the magnitude of the peak was substantially lower than that observed in the 1920s and 1930s.
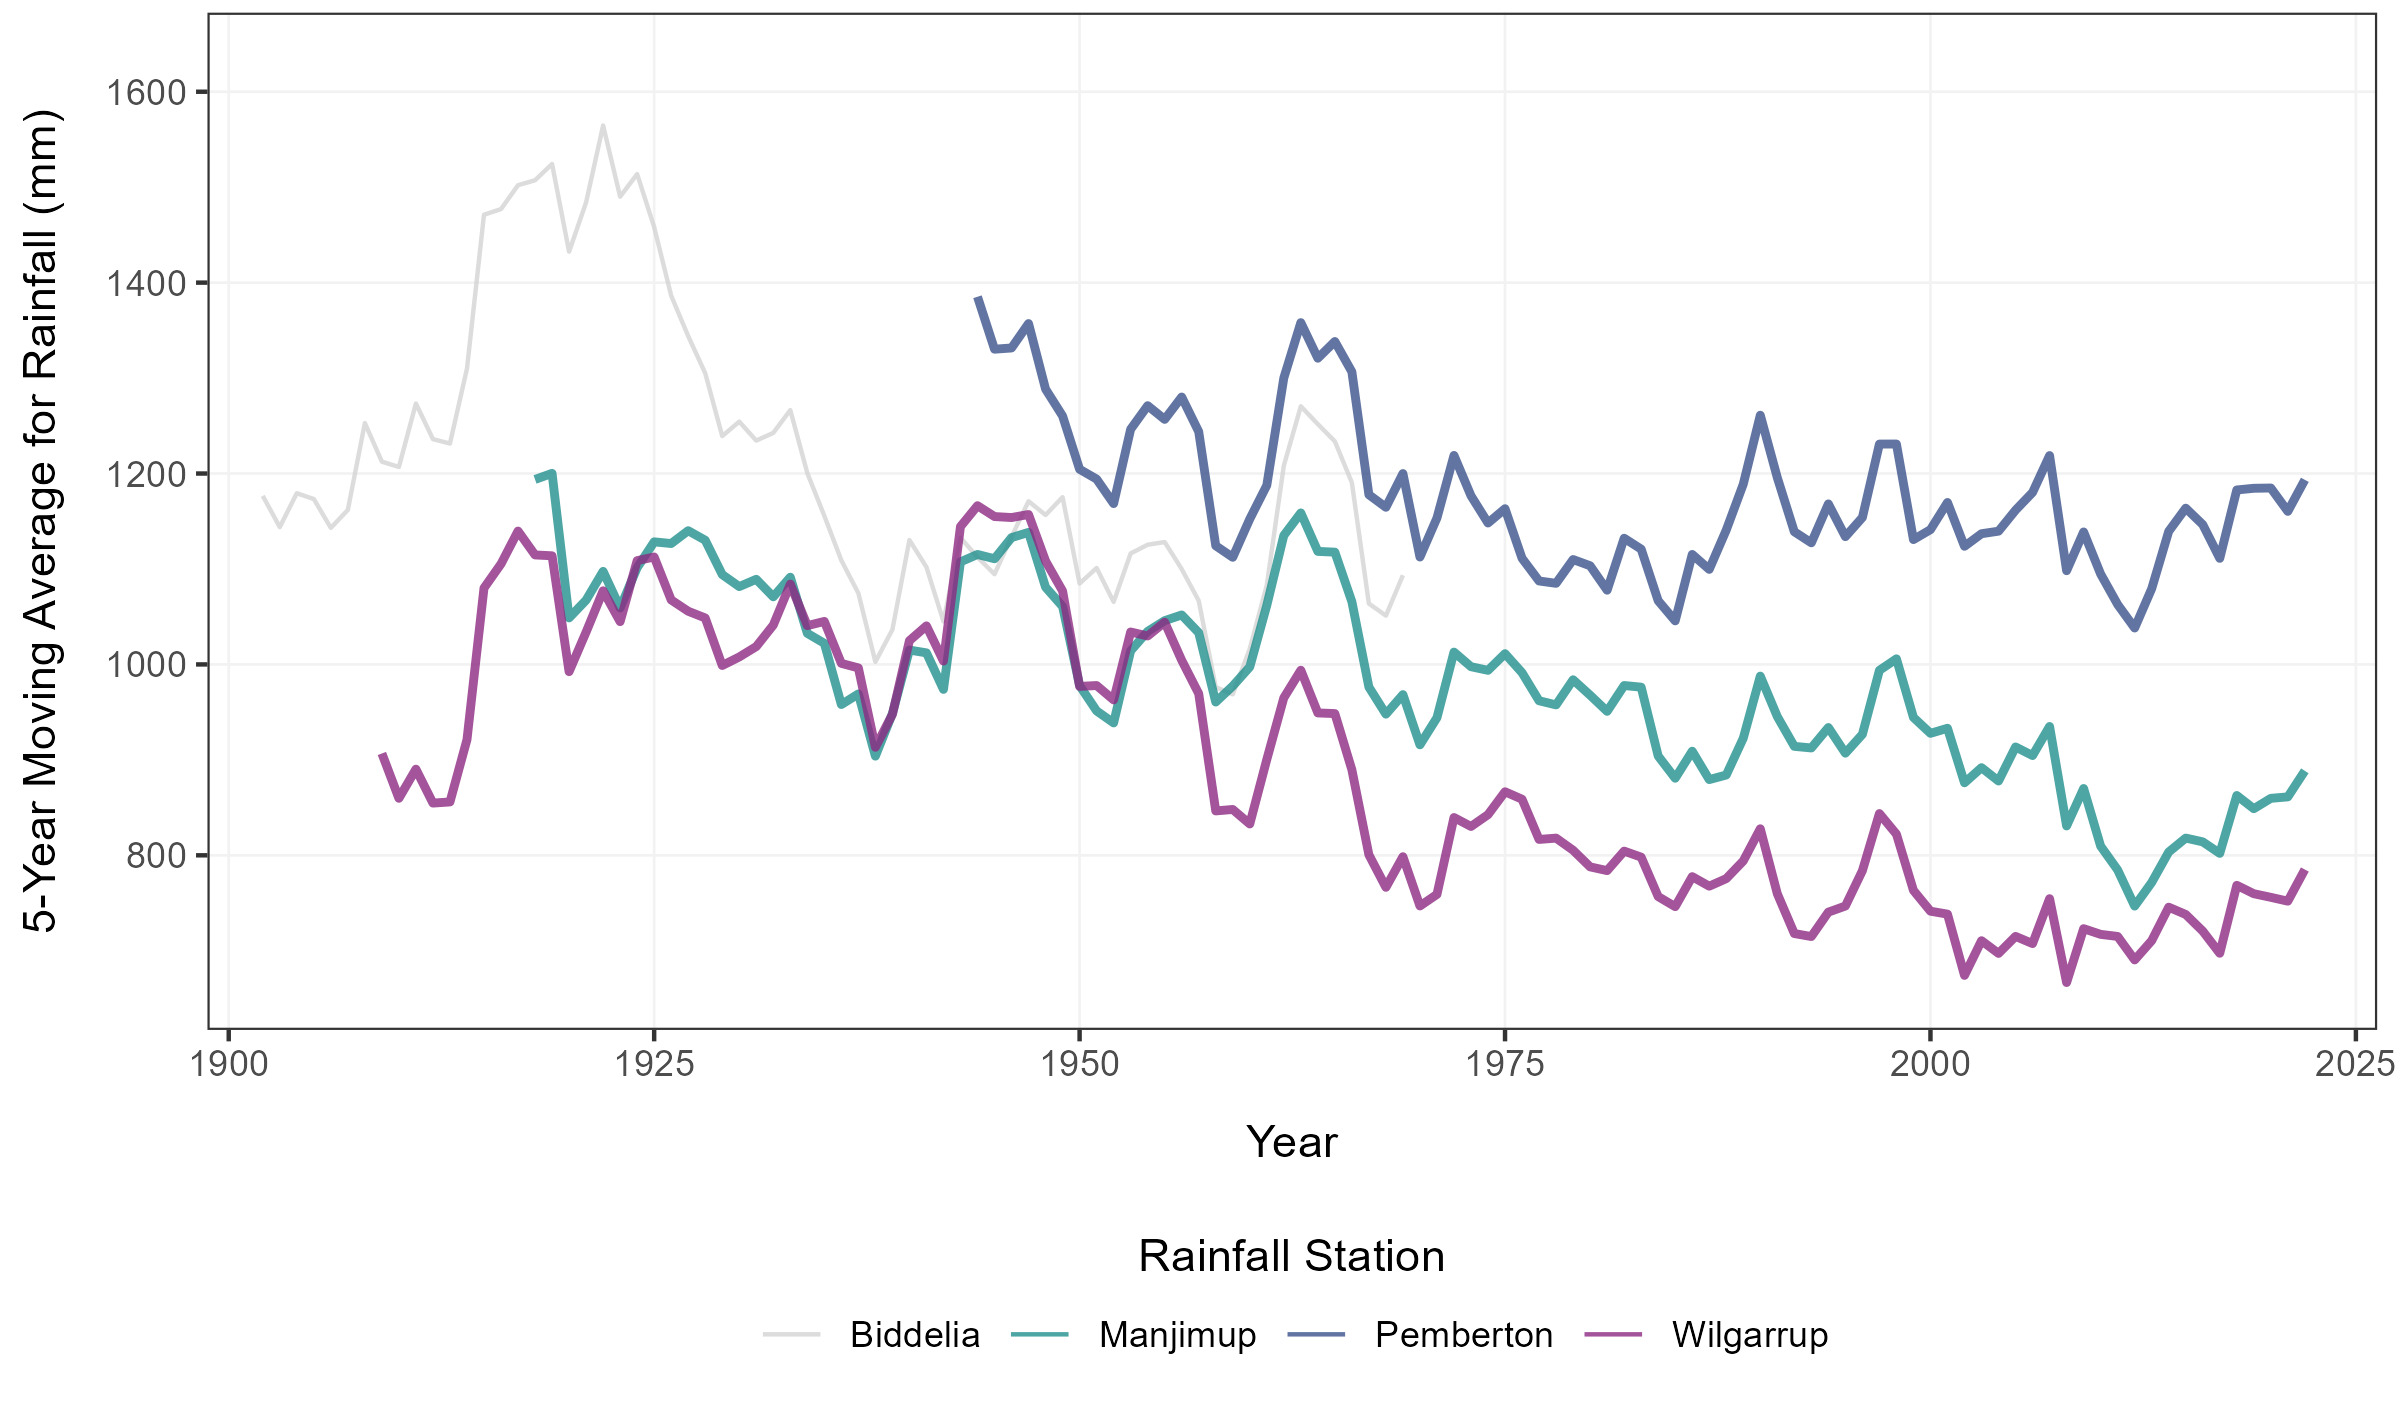
Table 2 summarises changes in annual rainfall totals for gauges representative of the research catchments shown in Fig. 1. All groundwater records in the research catchments commenced in the mid 1970s, so changes in rainfall in 2001-2024 with respect to 1975-2000 are directly relevant to calculated changes in groundwater level. Streamflow gauging at Strickland commenced in 1952, therefore rainfall changes in 1975-2000 and 2001-2024, with respect 1952-74 are relevant to changes in streamflow. The Manjimup and Wilgarrup gauges are representative of the upper portion of the Donnelly catchment above Strickland, whereas the Pemberton gauge reflects the lower catchment (Fig. 1a).
Table 2 shows rainfall reductions at the Manjimup and Wilgarrup gauges between 1927-51 and 2001-2024. At Manjimup, the most substantial and significant reduction occurred at the end of that period. Conversely, at Wilgarrup, the most substantial and significant reduction occurred at the beginning of that period. At Manjimup (1916-present), the total rainfall reduction in 2001-24 relative to 1952-74 was 17%; at Wilgarrup (1907-present), it was 19%. P-values indicate very strong evidence that these reductions were real and significant. There were no statistically significant rainfall changes at Pemberton (1942–present) over the same period.
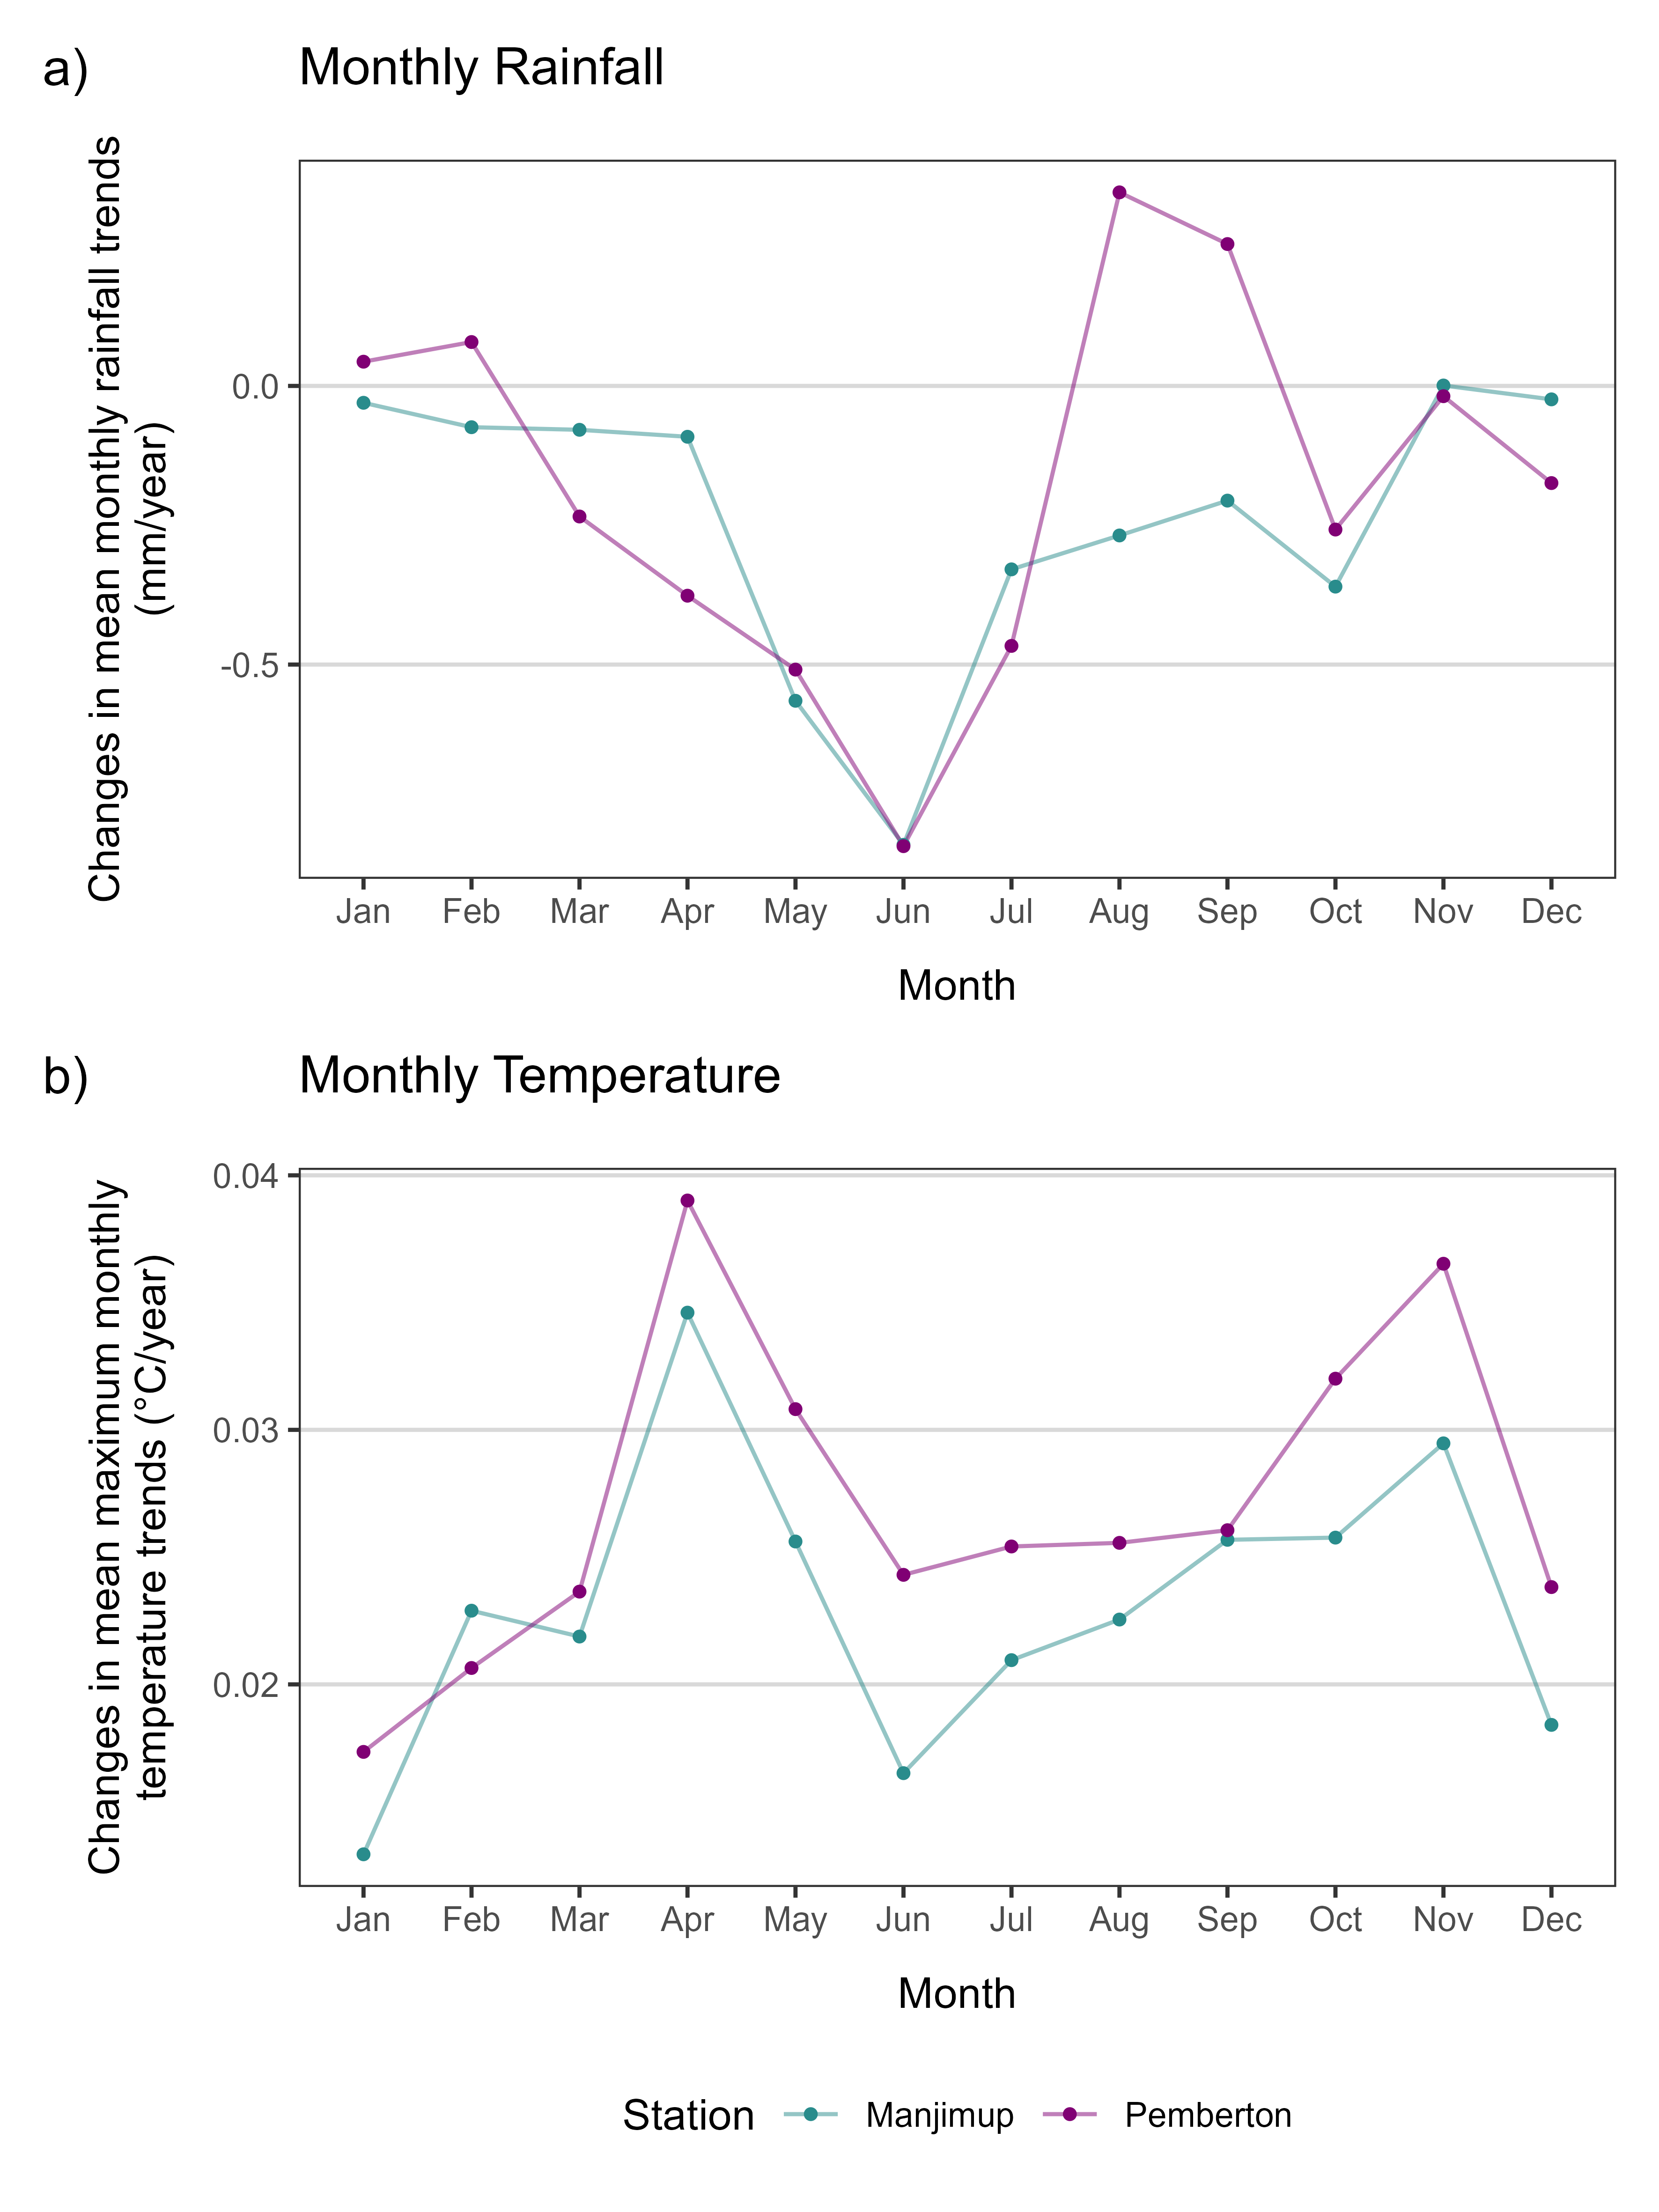
Analysis of monthly rainfall data suggests declining rainfall is concentrated in the early-winter months for both Manjimup and Pemberton (Figure 4a), with little change observed across late-spring and summer. The most significant seasonal rainfall changes are observed at Pemberton, despite the absence of a significant change in annual totals, over the period of analysis (Table 2). Mid-winter to early-spring rainfall at Manjimup is subdued, however, rates of increasing rainfall have been observed at Pemberton over similar seasons. Histograms of daily rainfall totals for the three analysis periods (supplied in the Supplementary Materials, S1) show that Pemberton and Wilgarrup both received slight increases in the number of daily totals in excess of 60 mm, over time. At Manjimup, the frequency of daily totals reduced with time. Wilgarrup, the most inland of the gauges, with the lowest mean annual rainfall experienced a marked increase in the number of rain-free days compared to Manjimup and Pemberton. No tests for the statistical significance of these trends were attempted.
Plots of monthly rainfall across the entire period of record for Manjimup and Pemberton are provided in the Supplementary Materials (S2a and S2b, respectively), along with Mann-Kendall trend test results (S2c).
Maximum temperature
Mann-Kendall trend tests revealed that there have been consistent and statistically significant rates of increase in mean daily maximum temperature (0.02 to 0.03 degrees per year) at both Manjimup and Pemberton for most months of the year. Individual plots of mean monthly maximum temperature (supplied in the Supplementary Materials, S3a and S3b for Manjimup and Pemberton, respectively) show that while the interannual variability was pronounced, there is a pattern of greatest increase in early autumn and late spring. There was no autocorrelation in the mean monthly maximum temperature time series. Levels of statistical significance for rates of change by month are also reported in the Supplementary Materials (S3c). Figure 4b shows that the greatest rates of increase in mean daily temperature have occurred in April and November, i.e. early autumn and late-spring.
_monthly_rainfall_(mm_year)_and_(b)_mean_monthly_maximum_temperatu.png)
Groundwater analyses
Hydrographs for the research catchments are shown in Fig. 5 and Fig. 6 and highlight groundwater level changes in the three comparison research catchments (Borg et al. 1987b) and the paired catchments (Borg et al. 1987a; Bari et al. 1996), during the Woodchip project and recently.
__iffley_(b)_and_poole_(c)_comparison_catchment.png)
_and_stream_zone_(blue)_bores_in_the.png)
Borg et al. (1987a, 1987b) show that pre-treatment depth to groundwater of all bores in stream zones, were within 0-2 m of the surface or above ground (0 to +1 m) in high rainfall catchments. Bore water levels on the hillslopes were initially 5-20 m below ground level (m bgl). Logging induced a rapid rise in watertables in all treated catchments (piezometric levels reached +3 m in some valley bores), receding over time towards initial conditions. In some catchments, water levels had not recovered by the end of the trial (e.g. Lewin South). An overall trend of falling watertables was apparent in two of the unlogged catchments in the high rainfall zone (Iffley comparison bores, April Road South – Control). Bari et al. (1996) attributed this reduction in levels at these sites to the drier conditions (10% reduced mean annal rainfall) experienced during the trials.
Seasonal amplitude of watertables (>2 m) in pre-treatment data reflects the pattern of persistent winter rainfalls and seasonality of evapotranspiration. Summer watertable lows typically occur at the end of the period of highest temperature and evapotranspiration. After treatment (logging) amplitudes initially increase, then diminish (see Lewin South v North, April South v North) as watertables recess as vegetation recovers. Seasonality and amplitude of response also reduces as watertables deepen (e.g. Lewin South and April North).
Changes in water levels in the period post-2000, and especially after the dry period 2010–2012, are pronounced when contrasted to the Woodchip period. The exceptions are the two catchments noted above (Iffley comparison bores, April Road South – Control), and the low rainfall Yerraminnup catchments, which show a subdued response. During this period, 73% of bores that were lost from the dataset, are likely to have become dry.
Whole of record water levels have fallen in all catchments. Table 3 shows watertables under paired catchments have fallen on average 5.1 m between the late 1970s and 2024, or 6.1 m excluding the lower rainfall Yerraminnup catchments. For the high rainfall comparison catchments, average net falls were greater at 6.7 m.
Table 4 shows that the median rate of fall in paired catchment bores ranges from 0.11 to 0.13 m/yr under both hillslopes and stream zone areas (range from 0.05 to 0.23 m/yr). Excluding Yerraminnup, the rates of fall range increases slightly (0.12 to 0.14 m/yr), while in the comparison catchments, rates were 0.13 to 0.16 m/yr for the stream zone and hillslopes. Rates of decline from bores taken from the end of the treatment period to the present increase because of the impact of the early treatments (range 0.08 to 0.43 m/yr).
Using the assumptions noted, reduced watertables equate to average losses of 42% of the saturated zone storage under the stream zone and up to 64% under hillslopes (Table 3). The timing and magnitude of reduction is variable between catchments and in some cases has accelerated since 2000 and the very dry 2010-12 period. If median rates of decline are sustained, saturated regolith beneath some catchments (hillslopes) may be depleted within about 50-100 years. In the valleys, depletion may take longer, though substantial saturated areas could be lost by the end of this century. These rates and amounts are subject to the limitations of the data available and should be interpreted with appropriate caution.
Comparison catchments (Iffley, Crowea and Poole)
Hydrographs show substantial reductions in watertables in all comparison catchments. The greatest declines are apparent at Iffley and Crowea (Fig. 5). At Iffley, falls ranged from 8.6–12.0 m at the four treated bore sites, while watertables in the two control bores (bores 60818219 and 60818202) fell by 7.6 m and 8.3 m over the 49-year record (Figure 5). Control bores at Iffley declined from the commencement of monitoring.
At Crowea, the groundwater response was greatest in the four treatment bores (average 9.7 m decline), with a comparatively minor fall of ~3.0 m recorded in the control bore (bore 60718620). A similar trend was observed in Poole catchment with least response in the two control bores (mean groundwater fall of ~2.7 m in bores 60718717 and 60718720), and a greater response (range: 5.1 m – 9.3 m) recorded in the two treatment bores (bores 60718705 and 60718702). No pre-treatment trends are obvious in the Crowea or Poole catchments.
One Poole stream zone bore shows the only rise recorded in this study, with a watertable recovery of ~2 m (Bore 60718702) from its post 2000 decline. This bore is adjacent to forest thinned in 2019, as part of routine silvicultural treatment for regrowth karri (DBCA pers comm, 2021).
Paired catchments (Lewin, April-March, Yerraminnup)
Change in watertables across the period of record (Borg et al. 1987a) vary between treatments and landscape position in paired catchments (Fig. 6). In the high rainfall Lewin catchments, watertable falls in the treated catchment (Lewin South; 12 bores; average change of 4.5 m) were slightly lower than in the control catchment (Lewin North; 11 bores; average change of 5.4 m). A similar trend was observed in the intermediate rainfall zone, with larger water table declines observed in the control catchment (April Road South; 5 bores; average change of 6.4 m) compared to the treated catchment (April Road North; 5 bores; average change of 4.8 m), noting that the April Road North catchment contains a wide stream zone buffer of mature forest and that bore 60718306 had regularly been overflowing during the early part of the record. Insufficient bores remain in the low rainfall Yerraminnup catchments to define a catchment-wide response. From available bores, the magnitude of response (~ 2 m) is much lower here, than in intermediate or high rainfall zones.
The median rate of decline of watertables also varies with landscape position. In the Lewin North (control) catchment, rates of decline in stream zone bores (0.16 m/yr) are slightly lower than in the treated Lewin South catchment (0.20 m/yr), based on the last available data point pre-2000 (italicised numbers in Table 4). Median watertable declines under the hillslope on Lewin North (control) are 0.18 m/yr and 0.15 m/yr in the treated Lewin South. At April Road North, the decline in the logged stream zone was 0.12 m/yr compared to 0.20 m/yr in the control catchment. There were insufficient bores on the hillslope at this catchment for analysis. The treated March Road catchment has the highest rate of fall of all catchments (0.38 m/yr and 0.42 m/yr for the stream zones and hillslopes, respectively).
Streamflow analyses
Figure 7 plots Donnelly River (Strickland) annual streamflow totals and the 5-year moving average (Fig. 7a), with rainfall totals and 5-year moving averages (Fig. 7b) and accumulated annual residual rainfall (Fig. 7c) for Manjimup, Pemberton and Wilgarrup. The plot demonstrates high inter-annual variability in Strickland flow from the beginning of the record in 1952 to 1974, after which there is a marked reduction in both annual streamflow and inter-annual variability. There is a second marked reduction in both variables from 2000. This contrasts with more subdued relative changes in annual rainfall totals (Fig. 7b), A downward trend is evident from ~ 1970-1975 (Fig. 7c) that is particularly noticeable for the inland Wilgarrup gauge.
_for_the_long-term_streamflow_gauge_at_stri.png)
Statistical analyses presented in Table 2, indicate that there were significant reductions in Strickland streamflow in 1975-2000 and 2001-24 relative to 1952-74 and that the relative reduction over the period of record was 66% (90 to 30 mm/y); greater than the 17-19% rainfall reduction (e.g.1022 to 844 mm/y at Manjimup) calculated for the relevant rain gauges. Bootstrapped confidence intervals provide very strong evidence that the calculated reductions in mean flows reflect a declining trend rather than high interannual variability within and between all periods considered.
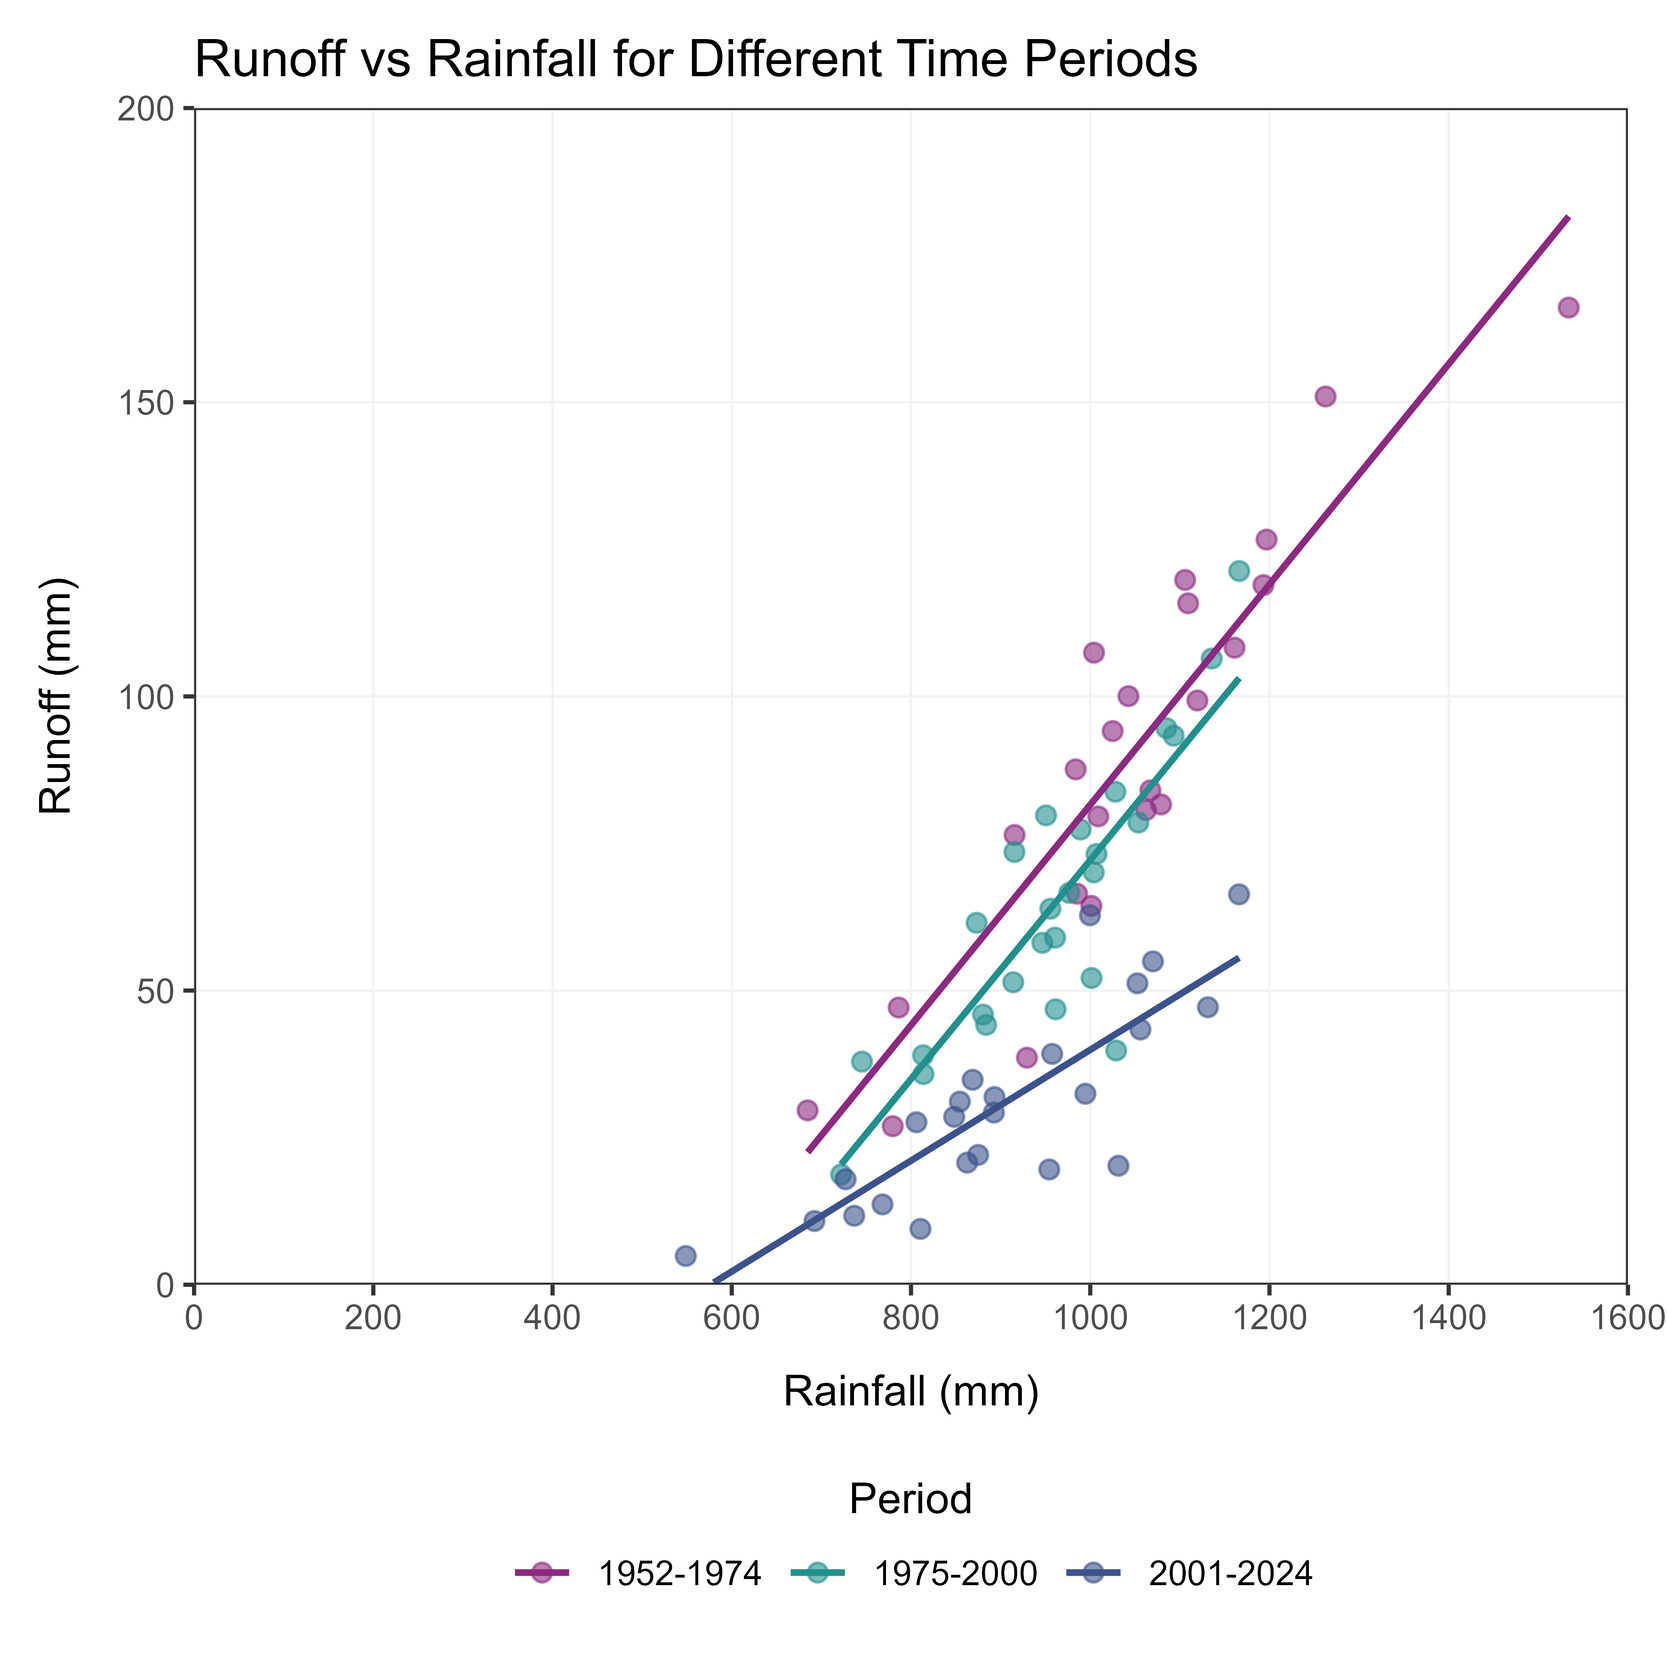
Figure 8 displays Strickland annual streamflow totals for the three periods considered above, plotted against the mean of the annual rainfall totals for the Manjimup, Wilgarrup and Pemberton rain gauges. The Pemberton gauge is not located in the Donnelly Catchment (Fig. 1), however it is the only long-term site available to represent the lower catchment, where notably, there has been the least decline in recorded rainfall. Lines of best fit between streamflow and rainfall are shown for each period. The lines of the best fit for 1954-74 and 1975-2000 are almost parallel; the runoff coefficients for the first two periods are 0.083 and 0.066, but 2001-24 is substantially less; 0.032. The coefficient of determination (R2) for the 2001-24 is also lower than for 1954-74 and 1975-2000; 0.685 compared to 0.843 and 0.733.
In addition to annual streamflow totals declining in 1975-2000 and 2001-24, relative to 1954-74, the number of no-flow days per year increased. The Donnelly River at Strickland gauge was perennial until the period commencing 1975. From 1975-2000, cessation of flow was observed in two of the 25 years; for 70 days in 1988 and 75 days in 1995. During 2001-2024, flow ceased in 18 of the 23 years, for periods ranging from 3 to 112 days. In 2024, flow ceased for 149 days.
Figure 9 shows annual streamflow volume (mm) for the Donnelly River at Strickland in relation to periods for which there was no flow at the gauge. There is no consistent relationship between total annual flow and the length of the no-flow period. There is however, a clear reduction in annual flow from 2001 and the onset of consistent no-flow periods. Annual rainfall for 2001, at Manjimup was 785 mm (12th percentile); at Pemberton it was 921 mm (7th percentile). The Donnelly ceased flowing at Strickland on 25 February 2002 and flow was not reinitiated until 16 April 2002. From 2002 to 2024, there were no-flow periods every year except 2006, 2009 and 2017. These first two ‘summer flow’ events were preceded by wet years (91.6 GL, 72.6 GL) and in 2016, by the highest annual flow (110.6 GL, or 66mm) recently recorded. By contrast, the 2009 high annual flows (104.7 GL) were followed by extended periods of no flow in 2010.
_for_the_donnelly_river_at_strickland_gauge_plotted_with_no-flow_periods_.png)
In addition to an increase in the frequency of no flow periods, there have been other seasonal changes in the flow regime at Strickland. Plots of monthly streamflow totals by year, presented in the Supplementary Materials (S4), show that the winter months with the highest monthly flow totals have experienced the largest proportional flow reductions over the period of record. They also have the highest interannual variability in total flow.
Discussion
Climate and watertable decline
Rainfall records for the Southern Forest show a short period of low rainfall prior to 1916, then a relatively long pluvial period in the middle of the 20th century, ending in the late 1960s. Thereafter drier conditions developed during the 1970s when the Woodchip catchment experiments commenced. Data summarised in Fig. 2 and Table 2 show that the drying trend is widespread but also demonstrates spatial and temporal variability. Today Global Climate Models for the region define this post 1970s period as evidence of anthropogenic induced drying (Bates et al. 2008; Grose et al. 2020).
The early to mid-20th century pluvial is recognised to be wet in the context of the paleogeographic record in the broader Southwest region (O’Donnell et al. 2021). O’Donnell et al. (2021) use dendrochronology to describe climate variability over the last 668 years at a site on the eastern edge of the agricultural area (~400 km NE), and concluded that the record contains more numerous multi-decadal megadroughts than pluvials. They also contend the recent 20th century pluvials have not had an analogous period since the 1400s.
The O’Donnell et al. (2021) description of natural variability is generally consistent with a 2038-year reconstructed palaeoclimate using data from East Antarctica, which focuses on the south-west of Western Australia, and includes the Southern Forest region (Zheng et al. 2021). Zheng et al. (2021) describe the last century pluvial, within the context of statistically significant reductions in rainfall, which commenced after 1850, and accelerated due to anthropogenic forcing after 1971. Rauniyar et al. (2023) indicate that external forcing likely accounts for up to 66% of the observed drying, and like Zheng et al. (2021), that natural variability remains a contributing factor. Rauniyar et al. (2023) project that over 70% of years in the late twenty-first century will be drier than the driest year recorded between 1901 and 1960. These studies have relevance to understanding past and future climate drivers, the hydrologic response of the forests to wet and dry periods and provide context to our multi-decadal measurements in the Woodchip bores.
Early onset declines in watertables (1975 – 1996) due to reduced rainfall can be seen in untreated catchments (e.g. April South, Iffley control; Figs. 5, 6), with monotonic reducing levels (Martin 1986; Borg et al. 1987a, 1987b). In our recent data, we see these forementioned sites carrying forward these initial trends, where after 2000, the decline has steepened and broadened to all catchments, whether treated or not.
Rates of watertable decline can also be attributed to episodic events, such as 2010-12 period, which had the lowest recorded annual and winter rainfall (<50% of annual average; 2010) and resulted in two of the lowest Donnelly River flows (2010, 2012). In addition, increasing temperatures in spring and autumn are likely to have an additive impact, driving greater forest evapotranspiration, dewatering the regolith. While extensive forest collapse has not been reported in the Southern Forest, it was reported in the northern jarrah forest after 2010, notably where the regolith was less than 12 m thick (McGrath et al. 2023). Quantifying this risk in Southern Forests should be the subject of further work.
Reductions in near-surface saturation changes how runoff is generated. International and local runoff generation literature (Bosch and Hewlett 1982; George & Conacher 1993; Bari et al. 1996) show that without extensive, permanent, groundwater-fed saturated areas, runoff diminishes (Grigg and Kinal 2020). In the catchments studied, pressure heads in regolith aquifers were initially at or above ground level and enhanced after forest logging (generating large flows) but are now between 5 to 13 m below the stream zone. As a result, without deep groundwater, large runoff events are dependent on continuous periods of high rainfall, that develop extensive perched watertables (generating saturation excess overland flow), of sufficient duration to create sustained runoff. In the Southern Forest, this limits high flows from July to September. Such high winter rains and subsequent flows generated by near surface saturation have been observed in past 20 years, e.g. 2009 and 2016, however their frequency has reduced substantially. Guidance from GCM models and related CSIRO studies (e.g. Rauniyar et al. 2023) advise the frequency of such events is likely to reduce.
Treatment effects on watertables
In the paired catchments, after recovery from logging, there was little difference in the magnitude and rate of fall between the treated and control catchments (Tables 3, 4), suggesting the dominance of factors such as climate. However, in two of the three comparison catchments, there appears to be a residual effect. Control bore mean water levels in Crowea and Poole catchments (Fig. 5) have remained relatively stable (Crowea 60718620; Poole 60818720, 60818717), or fallen less (2.0 to 2.7 m), when contrasted to the mean of treated bores (which fell 7.2 to 9.2 m). At Iffley, mean control water levels dropped by 8.0 m, a similar order to mean levels in logged areas (9.7 m). While speculative, this may reflect differences in the water use characteristics between mature and young regenerating tree stands related to canopy leaf area, sapwood area and forest structure, consistent with observations by McFarlane et al. (2010). However, forest density effects on the observed groundwater levels are confounded by the number of bores (statistics), logging date (comparison bores were logged 5-6 years before pairs), and local site hydrology.
Drivers of streamflow reduction
Empirical studies in the Darling Ranges (Petrone et al. 2010; Hughes et al. 2012; Kinal and Stoneman 2012) revealed that while reduced winter rainfall initiated reductions of streamflow (1950-2008), it alone did not explain stepwise reductions observed later in the record (1989-2008). Only when the change in groundwater levels and disconnection of the watertable from the stream zone occurred (triggering system non-stationarity and changed runoff generation mechanisms) was there an adequate explanation of the 70% reduction observed in streamflow. Numerically, when watertables fell to at least 3 m below ground surface in the stream zone (Hughes et al. 2012), forest runoff coefficients dropped by greater than 50% (Petrone et al. 2010).
Like data from the Darling Ranges, we report a 66% reduction in flow of the Donnelly River at the mainstream gauge (Strickland). The greatest reduction in streamflow occurred in the period 2001-2024 (Fig. 8) which is coincident with large groundwater level declines post the mid-1990s (Fig. 6). In the Donnelly River, we also note that falling watertables are associated with diminished peak flows and increasing duration of ‘no flows’. The average duration of no flows during the period 2000-2010 was 27 days, which has increased to 79 days (2011 to 2024). Prior to 2000, only two years with short periods of no flow were recorded. In 2023-2024 summer, the river dried for 149 days, leaving only one mid-catchment river pool with residual water (see Fig. 9). This pool is located near one of the only areas in that catchment with persistent baseflow that emanates from nearby cleared farmland.
We conclude that, like in the Darling Ranges, falling groundwater levels in forested catchments and disconnection of the deep groundwater contributes to hydrologic non-stationarity. With reduced rainfall, this is the dominant factor accelerating streamflow decline. Together these become acute in dry years and impact natural systems.
Future changes in stream flows
Based on the recommended approach of Hughes et al. (2021), Hughes and Wang (2022) built a numerical model of the Donnelly River catchment to understand observed flow reductions and reliability of future flows. The model is based on a simple conceptualisation that explicitly allows for system non-stationarity with a parsimonious number of parameters. The model combined climatic and hydrologic data, novel space-for-time substitution (to account for increasing aridity) and trends in forest leaf area, to explain the observed reduction in flows within the Donnelly River. Hughes and Wang (2022) also used climate combinations from CMIP5 GCM model ensembles, multiple river scenarios and two anthropogenic, representative concentration pathways (RCP4.5; RCP8.5) to derive future streamflow simulations. These specifically accounted for the various hydrologic effects of cleared and forested catchments, although they did not have access to, nor specifically use, water table data presented herein. Their model updated earlier work by HARC (2018) which was based on GR4J and previous CMIP3 forecast climates.
Hughes and Wang (2022) showed that with forecast increasing levels of greenhouse gasses (RCP4.5), mean annual streamflow at Strickland gauge could reduce from the 50.4 GL (2001-2020) to 29.5 GL (RCP4.5, 41% reduction), or to 26.1 GL (RCP8.5, 48% reduction) by 2059. The calibrated model generated mean annual flows of 56.6 GL for the period (2001-2020) (Table 5). Similarly, the model predicted that by 2059, average flows at stream gauges in other Donnelly sub-catchments (excluding Record Brook, Table 5), could reduce by 33-41% (RCP4.5) and at RCP8.5, by as much as 42-48% by 2059. This modelling is consistent with similar projections by Zheng et al. (2024) and others, premised on continued reductions in rainfall forecast for southwestern Australia.
Modelled streamflow gauging (2011-2020) indicates that the mostly cleared Manjimup Brook (148 km2) catchment contributes a disproportionally high amount of 44% (range 26–52%) of the total flows of the catchment above Chappells Bridge. Annual flow is also less affected by climate. Modelling predicts that in the future, the proportion of flow contributed by forested areas will account for less than 20% of streamflow. Hind casting using the model suggests that the forest previously contributed >60% of runoff at Chappells Bridge (Hughes and Wang 2022). Validating changes to the relative contribution of cleared land and forest becomes significant in the context of defining water available for allocation to agriculture and the environment.
Future Priorities
Australian and international climate models forecast that the Southwest of Western Australia (SWWA) is almost certain (90% confidence) to continue drying (Grose et al., 2017, 2020). As described above, reduced rainfall has already caused a 66% reduction in streamflow in the Donnelly River and reduced saturated zone water storage in the regolith. Future reductions in rainfall and streamflow, especially amplified by dry seasons like 2010, are therefore likely to further impact forest ecology and river hydrodynamics. Runoff from farmland may also be reduced, however as noted, not by the same amount.
The influence of non-stationarity has been recognised in the context of forest hydrology, runoff generation and modelling for over a decade. Experiments to determine if forest management can mitigate the magnitude of drying are underway in the Darling Ranges and have been shown to locally increase recharge and watertables (Kinal and Stoneman 2019). Locally, Bradshaw (2015) reported increased streamflow following silvicultural intervention in the catchment of the Manjimup water supply between 2003 and 2009, noting the importance of controlling stump coppice to prolong the response to thinning. In this paper, we note one catchment bore that appears to have responded to nearby thinning.
Ecological thinning has been proposed as a strategy in the now implemented Forest Management Plan 2024-2033, following recommendations from an independent expert panel tasked with reviewing silvicultural practices (Harper and Burrows 2022), and was scheduled to commence in the region in 2024-5. The experimental basis to underpin the extent and nature of ecological thinning prescriptions is limited and requires further work, particularly in the Southern Forest, which are characterised by different environmental factors, forest structure and species composition to the more extensively studied forests in water catchments closer to Perth.
In late 2022, streamflow gauging was re-established in the Lewin catchments and in 2024, also in Record Brook. Re-equipping these catchments allows forest management practices like ecological thinning to be tested after an appropriate control period (e.g. 5 years). Recommencing regular watertable monitoring of the Woodchip catchments studied here has also been proposed. With maintenance and replacement of important bore sites – and coupled with improved frequency and accuracy of remotely sensed products for deriving forest cover / LAI estimates – this can be used to underpin future modelling and landscape analysis. Monitoring cleared catchments should at least match the effort in the forests, given their importance to catchment flows, especially in dry years.
A coordinated approach to long term data collection, like that established and operated during the period of the Woodchip catchments, is needed to inform future water sharing in the Southern Forests. Improved models need to be built from empirical data that has been explicitly collected to quantify changing hydrologic processes. Monitoring of groundwater in the Lower Donnelly River, characterisation of the hydrodynamics of the perched aquifer, and use of stream salinity to identify runoff sources, remain as important gaps. Quantifying climate-driven non-stationarity is central to better predicting future water security for agriculture and the environment.
Conclusions
Multi-decadal analysis (1975-2024) of groundwater levels in the Southern Forest catchments indicates that watertables have declined by an average of 5.1 to 6.7 m (<0.16 m/yr) beneath the stream zone and hillslopes of the paired and comparison catchments, with some watertables falling by up to 12 m. The rate of decline has increased in recent years, especially following 2000 and record dry conditions in 2010-2012. These results are consistent with observed watertable reductions seen in catchments in the Darling Ranges.
Together, reduced rainfall and falling groundwater levels has triggered non-stationarity in forest hydrologic systems, resulting in a decreased streamflow of 66% in the Donnelly River. If future climatic conditions occur as projected, ongoing declines in streamflow are likely. Understanding the role of natural variability and local climate drivers is critical to better predict future streamflow.
The legacy Woodchip catchments, set up in a different time and for a different purpose, can now have an important role in ongoing studies of landscape hydrology. Moreover, they can help better forecast and mitigate the consequences of a drier and warmer climate and enable the equitable management of available water resources.
ACKNOWLEDGEMENTS
We would like to acknowledge the contribution of Joe Kinal (formerly DBCA Dwellingup) who initiated a condition audit of the Woodchip Licence Area catchments and drew attention to their importance in understanding multi-decadal hydrological trends in the Southern Forest. We also acknowledge Graeme Liddelow (formerly DBCA Manjimup) who located and refurbished many of the groundwater bores in these catchments. The manuscript was improved by comments from Justin Hughes, and anonymous reviewers. We thank the patience and support of many Manjimup farmers who sought to better understand Donnelly River hydrology.
SUPPLEMENTARY MATERIALS
Supplementary combined pdf file (Supplementary _Combined.pdf)
Contents:
S1: Histograms of daily rainfall totals for a) Manjimup, b) Pemberton and c) Wilgarrup
S2: Annual rainfall trends
S2a – Total monthly rainfall trends by month for Manjimup
S2b – Total monthly rainfall trends by month for Pemberton
S2c – Mann-Kendall trend test results for monthly rainfall data for
Manjimup and Pemberton
S3: Monthly temperature trends
S3a – Average daily maximum temperature trends by month for
Manjimup
S3b – Average daily maximum temperature trends by month for
Pemberton
S3c – Mann-Kendall trend test results for average daily maximum
temperature data by month for Manjimup and Pemberton
S4: Monthly discharge trends for Strickland gauge (Donnelly
River)