Introduction
Droughts and heatwaves are enduring features of arid and semi-arid environments worldwide (Bumbaco et al. 2013; Cook et al. 2018), to which many species and systems are well adapted (Fuller et al. 2014; Noakes et al. 2016; Bourne et al. 2020). Nonetheless, droughts can have far-reaching impacts, including biodiversity decline, threats to human life and food security and increased bushfire risk (Wasko et al. 2021; Kirono et al. 2020). Likewise, heat waves can severely affect societies, agricultural production systems, and terrestrial, aquatic, and marine environments (Robinson 2001; Wreford and Adger 2010; Oliver et al. 2018; Brás et al. 2021; Coughlan de Perez et al. 2023).
The frequency and severity of droughts and heatwaves are increasing due to global climate change (Kirono et al. 2020; Mbokodo et al. 2020; Vicente-Serrano et al. 2020). More frequent and severe droughts and heatwaves have had negative effects on a range of faunal and floral species (Cruz-McDonnell & Wolf 2016; Klockmann & Fischer 2017; Anderegg et al. 2019; Brivio et al. 2019; Mastrantonis et al. 2019; Sharpe et al. 2019), including mass mortality events and population declines (McKechnie & Wolf 2010; Saunders et al. 2011; Ratnayake et al. 2019; Pattinson et al. 2022).
Hot droughts, in which extremely high temperatures co-occur with extremely low rainfall, can exacerbate the impacts of both droughts and heatwaves (Albright et al. 2010; Overpeck 2013; Conrey et al. 2016; Bourne et al. 2020; Dezetter et al. 2022). Severe compound heat and drought events have been documented in several regions (Kreibich et al. 2022; Lemus-Cánovas et al. 2024). As the extent and duration of droughts and heatwaves are expected to increase (Overpeck 2013), the spatiotemporal overlap of these extremes will also increase and, along with it, the severity, extent and duration of hot droughts.
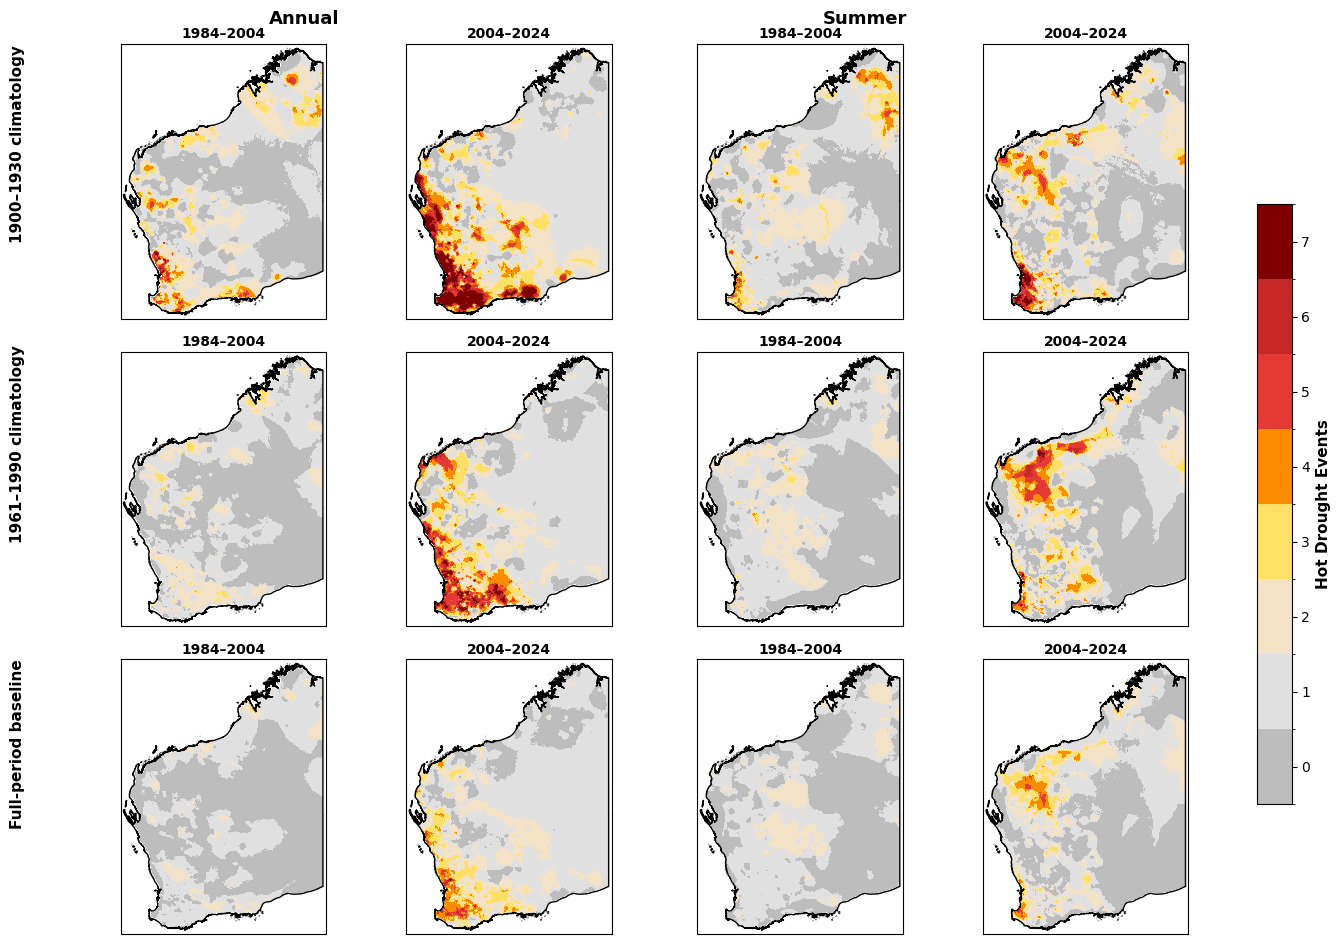
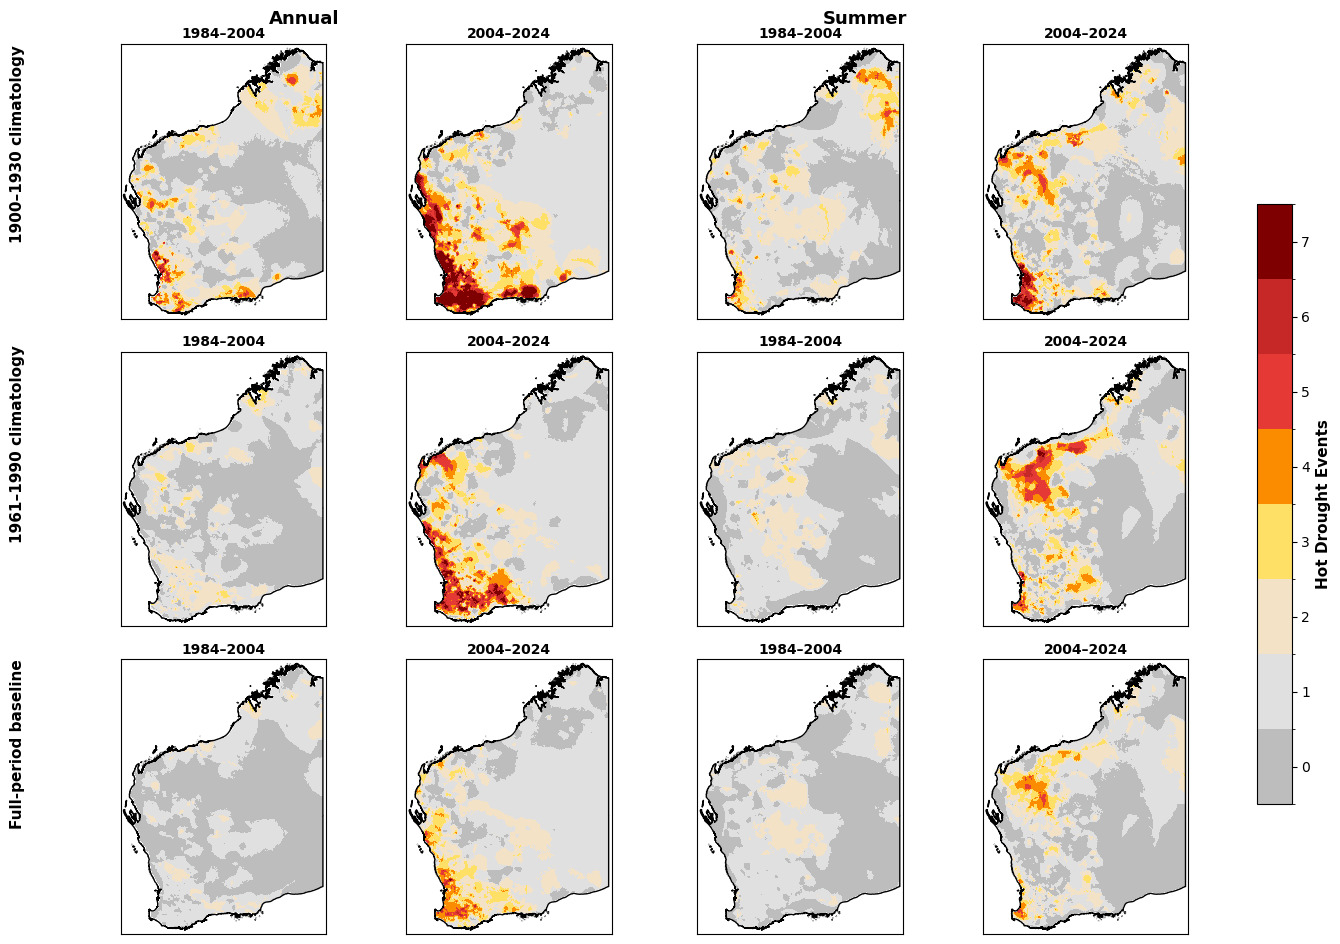
We analyse rainfall and temperature records for Western Australia (WA) from 1900 to 2025 and identify trends in the co-occurrence of extremely dry and extremely hot weather across time and space. We map the spatial extent and frequency of hot droughts in WA over these 125 years and statistically test whether recent hot drought events differ significantly from the historical mean. We also use monitoring data from four WA conservation reserves managed by the Australian Wildlife Conservancy (AWC) and affected by hot drought conditions in 2023 and 2024 to illustrate the impact of a recent hot drought in southwest WA on the region’s fauna and flora.
Methods
Frequency and severity of hot drought
We collated a time series of gridded climate data sourced through SILO Long Paddock (Jeffrey et al. 2001). SILO gridded data have a native resolution of 0.05° latitude by 0.05° longitude (approximately 5 km) and are derived by interpolating station observations. We sourced annual NetCDF files containing 12 monthly rainfall grids and daily maximum-temperature grids for WA from 1900 to February 2025. We summed annual rainfall across the monthly grids and averaged mean daily maximum temperature across the daily grids; austral summer analyses used December–February. For raster alignment and area calculations, we reprojected grids to WGS 84 / UTM zone 50S (EPSG:32750), resampled to 500 m using nearest-neighbour resampling, and clipped to WA. The 500 m processing grid does not increase the native spatial resolution of the SILO data. We calculated the 10th percentile of rainfall and the 90th percentile of maximum temperature for each climatological reference period. For this study, we classified locations with rainfall below the 10th percentile as drought, locations with maximum temperature above the 90th percentile as heatwave, and locations meeting both criteria as hot drought. We used these percentile thresholds as operational definitions to identify relative extremes consistently across the record. We calculated hot drought occurrence relative to three climatology periods (1900–1930, 1961–1990 and 1900–2025) and estimated the area (km2) affected in each year. Because SILO climate surfaces are interpolated from station observations, interpret early-twentieth-century estimates with greater caution, as the observing network was sparser than in later decades (Jeffrey et al. 2001). We restricted annual statistical analyses to complete years from 1900 to 2024. We grouped years into 20- and 40-year periods and tested overall differences using ordinary least squares with period as a categorical fixed effect and HC3 robust standard errors. We used pairwise period comparisons with Welch two-sample tests and a Holm adjustment. To test recent-period statements directly, we compared 2005–2024 and 1985–2024 with all preceding years, and 2005–2024 with 1935–1980, using Welch two-sample tests. Summer analyses described seasonal patterns.
Impacts of hot drought on flora and fauna
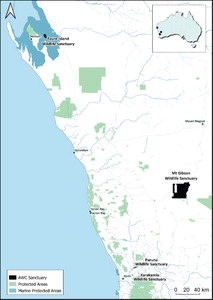
To provide examples of the impact of a recent hot drought in 2023–24 in the southwest WA region, we present empirical data collected on vegetation condition at Paruna Wildlife Sanctuary and a review of reported fauna population trends across multiple sanctuaries managed by AWC in southwest WA – Faure Island on Malgana Country, Karakamia and Paruna on Whadjuk Country and Mt Gibson on Badimia Country (Figure 1). At Paruna, we recorded the severity and extent of vegetation collapse by analysing vegetation condition in fixed-point photographs taken at 84 sites in May 2024. We randomly located sites across the sanctuary, stratified by major habitat type (Fig. S1, Supplementary Materials). We took fixed-point photographs facing south, in landscape orientation, using a 4:3 ratio, with the horizon one third from the top of the image. If the view was obscured to the south (e.g., a large tree directly in front of the post), we took the photo facing north (n = 16). Within each photograph, we estimated the percentage of vegetation with (1) unaffected crowns: no or minimal evidence of stress, (2) moderately affected crowns: predominantly dry and discoloured leaves, retaining some green foliage, and (3) severely affected crowns: complete crown dieback, no live healthy foliage. We then converted the per cent-estimate categories for moderately and severely affected trees and shrubs into a scoring system to facilitate comparisons (Table S1). We scored trees and shrubs separately, then summed the scores to obtain a total drought impact score (maximum possible score = 16).
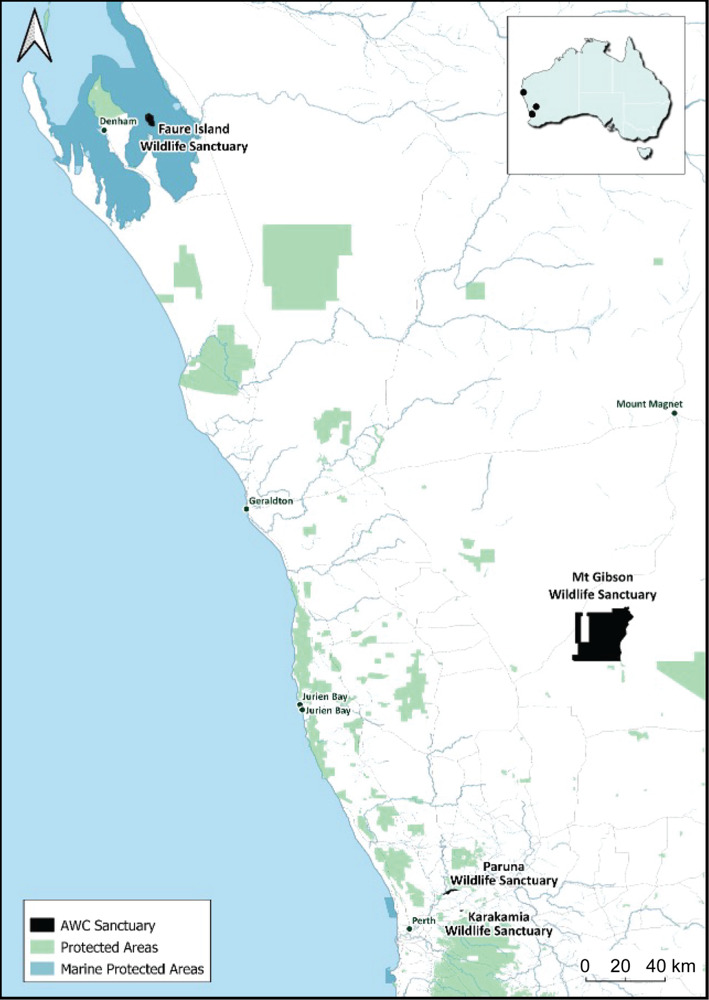
We considered reported population trend data (population estimate; index of abundance; naïve occupancy from camera, track plot or nest surveys – i.e. the proportion of survey sites where a species was detected at least once during a survey period) for 14 threatened and/or reintroduced vertebrate species (Kanowski et al. 2018; Hungerford et al. 2025; O’Neill et al. 2025; Palmer et al. 2025a, 2025b). We restricted the review to species with time-series data spanning the 2023–24 hot drought that were either extant at the site or reintroduced before 2020. For each species (n = 14; 19 site-species combinations), we categorised the magnitude of change between the pre-drought estimate (2022 or 2023 depending on the dataset) and the during- or post-drought estimate (2023 or 2024) as a large (≥50%) or moderate (20–49%) decline, stable (between 19% decline and 19% increase), or large (≥50%) or moderate (20–49%) increase. These categories account for natural population fluctuations due to environmental and demographic stochasticity (Taylor 1961; Lepš 1993; Lande et al. 2003). Large declines — > ~50% of population size — are generally considered ecologically significant because they surpass typical stochastic variation, while modest short-term changes in the order of 10–20% are often considered within the realm of natural environmental and demographic variability (Engen et al. 2003; Lande et al. 2003). Site-level temperature and rainfall data were taken from Australian Bureau of Meteorology (BOM) stations 006105 for Faure, 009007 and 010111 for Karakamia and Paruna, and 010075 for Mt Gibson.
Results
Frequency and severity of hot drought
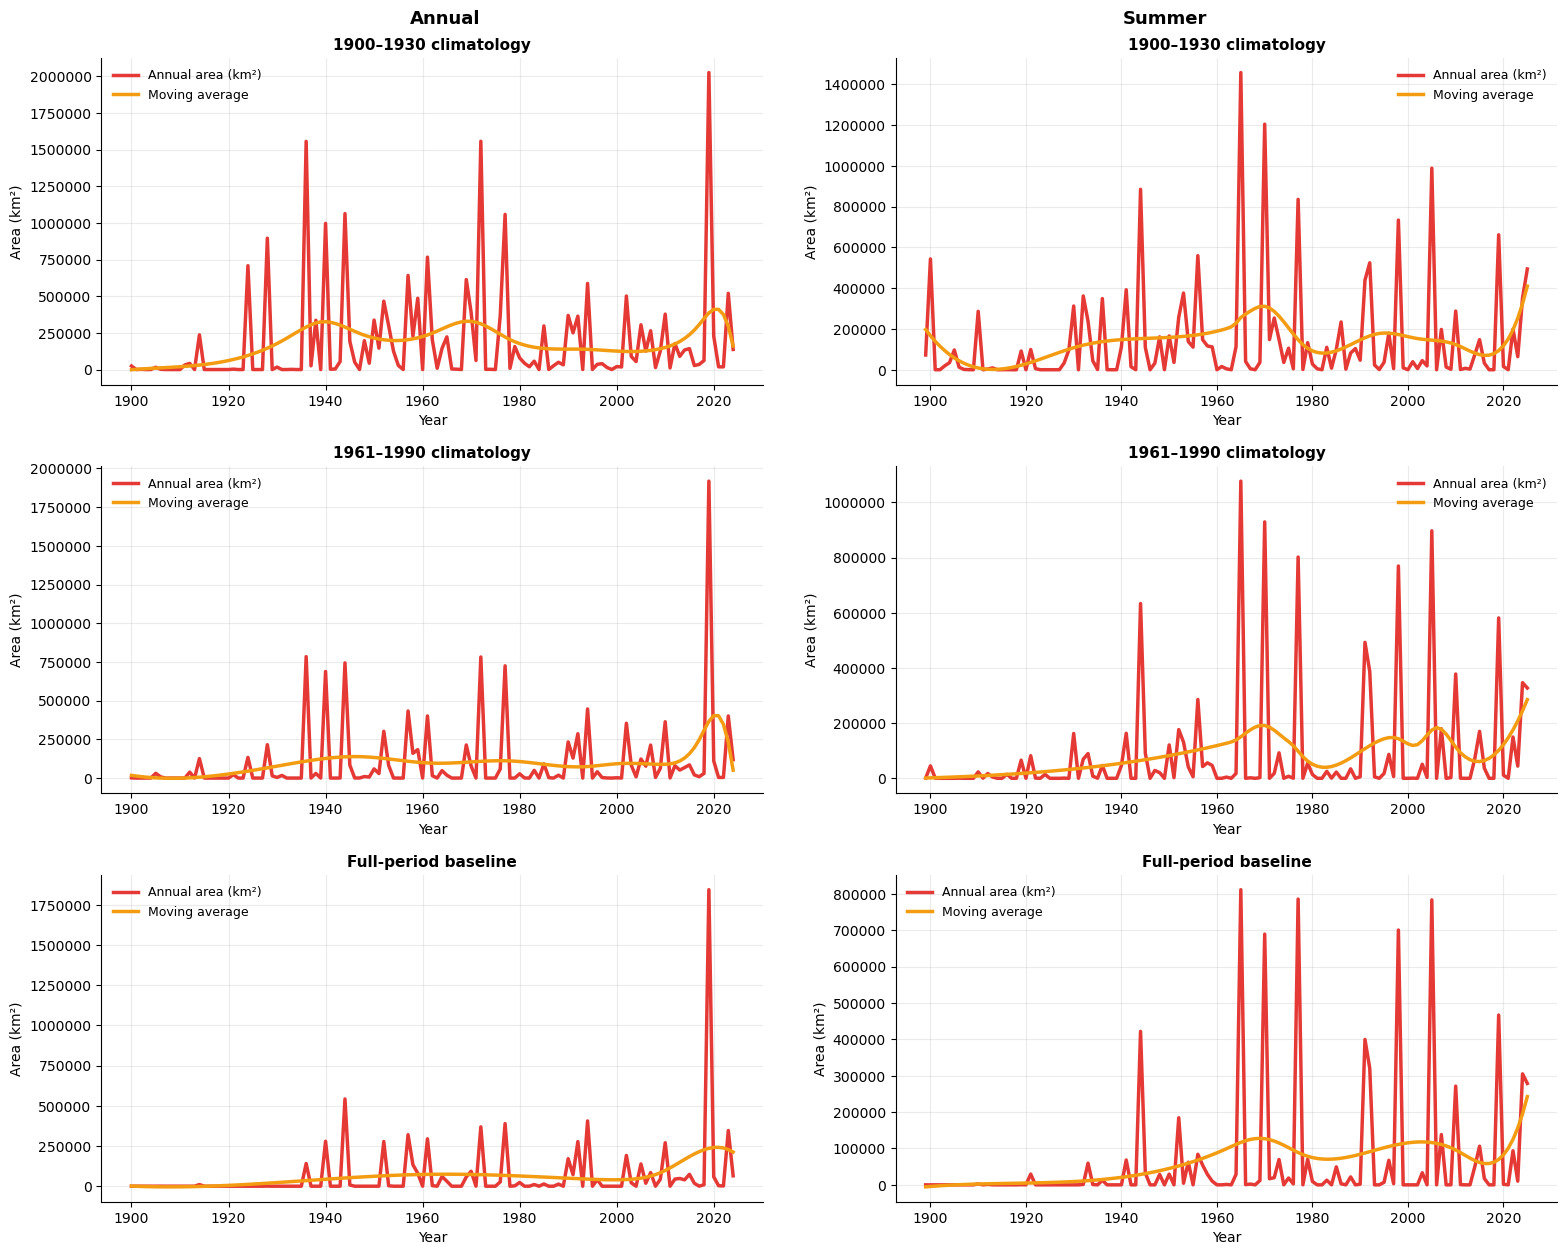
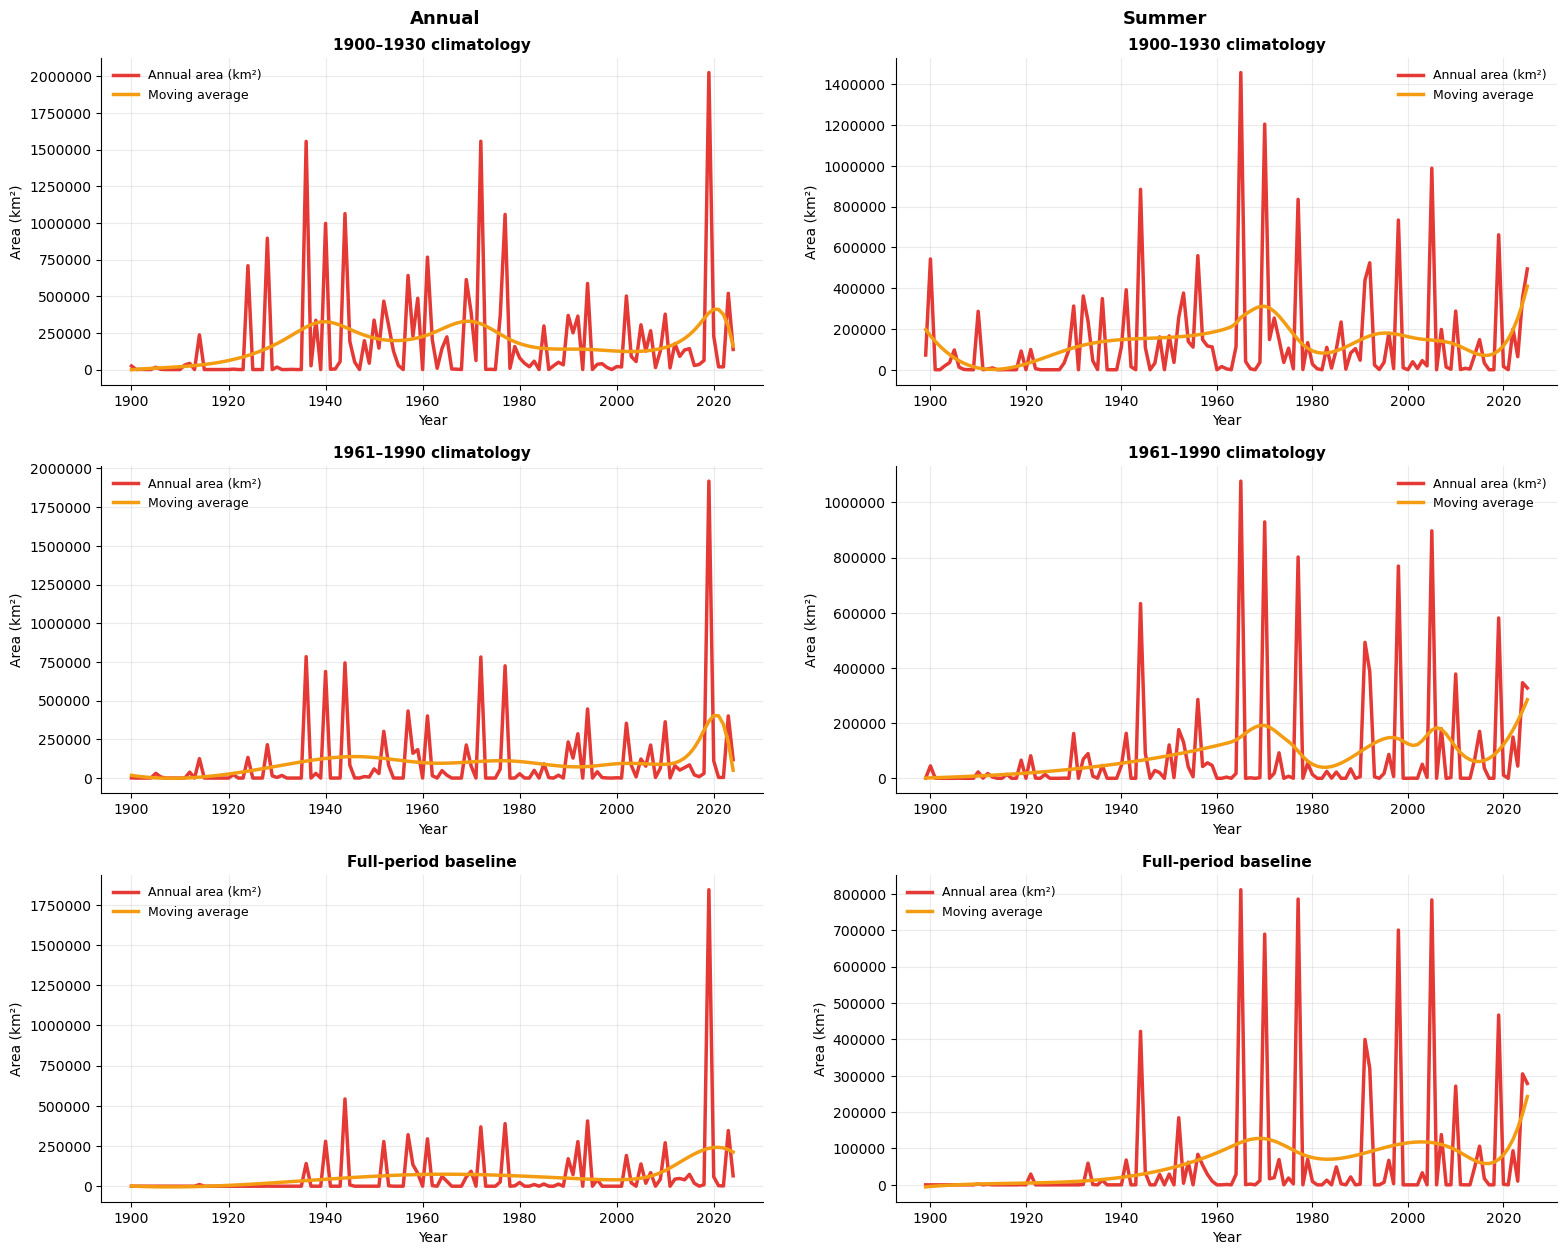
Across the annual dataset (1900–2024), mean hot drought area was 64,846 km2 per year. The largest annual extents occurred in 2019 (1,770,608 km2) and 2024 (973,105 km2; Figs S6 and S8, Supplementary Materials). Mean annual hot drought area was 189,776 km2 in 2005–2024 compared with 41,050 km2 in 1900–2004, a difference of 148,726 km2 (SE = 97,202 km2; 95% CI: -54,478 to 351,930 km2; p = 0.142). For 1985–2024, mean annual hot drought area was 120,652 km2 compared with 38,584 km2 in 1900–1984, a difference of 82,068 km2 (SE = 51,215 km2; 95% CI: -21,276 to 185,411 km2; p = 0.117). The 20-year period model showed an overall difference among periods (F(6, 118) = 2.69, p = 0.017), but no pairwise comparison remained significant after Holm adjustment (all adjusted p ≥ 0.873). The 40-year period model showed no overall difference among periods (F(3, 121) = 1.13, p = 0.341), and no pairwise comparison was significant after Holm adjustment (all adjusted p ≥ 0.669). The mean for 2005–2024 was also not significantly different from 1935–1980 (difference = 131,071 km2; SE = 98,300 km2; 95% CI: -73,836 to 335,979 km2; p = 0.197; Fig. 2). Although mean hot drought extent was substantially greater in recent decades, high interannual variability meant that these differences were not statistically significant.
Summer hot drought extent varied widely across the record (Fig. 2). Several large summer events occurred before 2000, including in 1977 and 1998, as well as in 2005 and more recent years. The 2019 summer hot drought affected 466,938 km2 and the 2023–24 summer event affected ~278,931 km2 (Figs S9–S12, Supplementary Materials).
Impacts of hot drought on flora and fauna
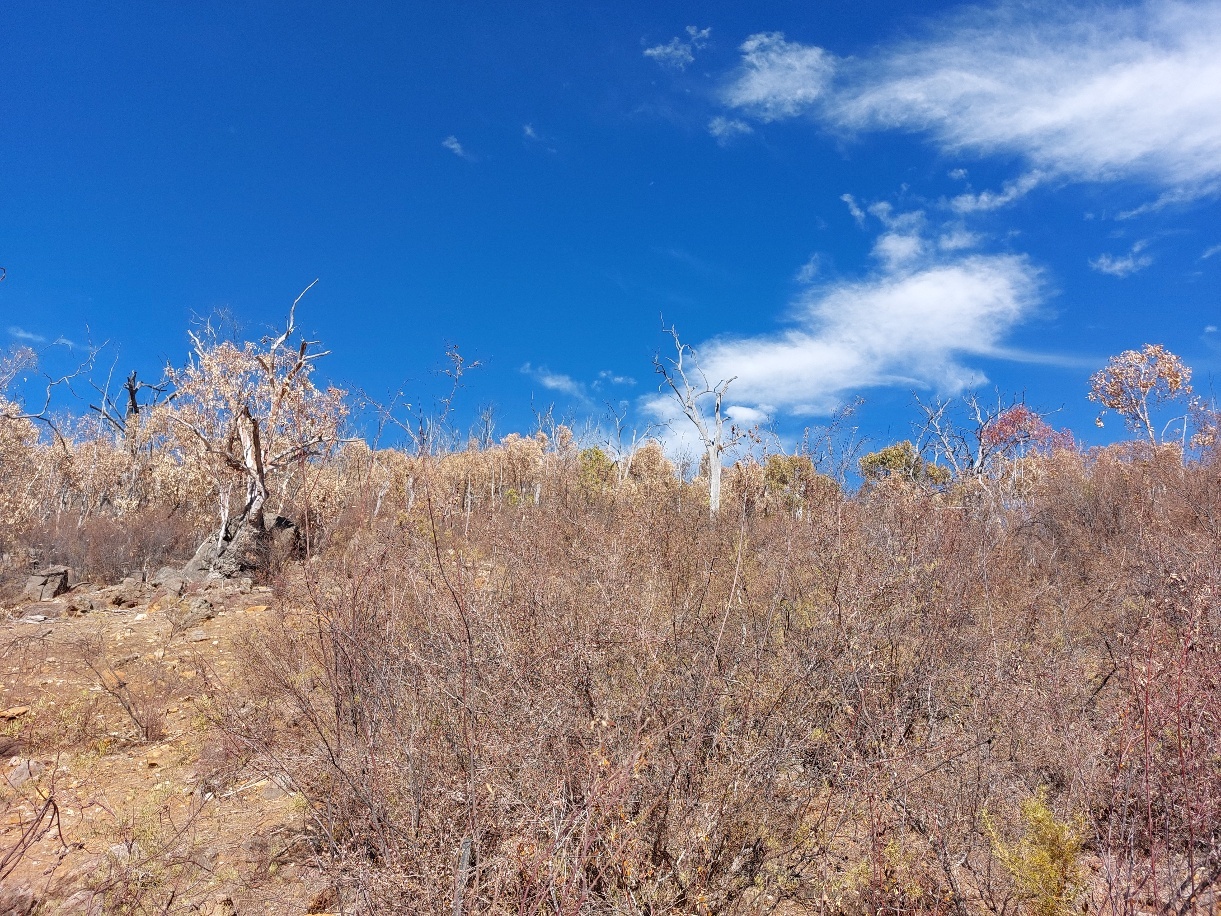
All four sanctuaries experienced hotter, drier-than-average conditions during 2023 and the first half of 2024. Paruna and Karakamia received 191 mm and 83 mm less rainfall than average and recorded maximum temperatures 1.5°C and 1.9°C above average, while Faure and Mt Gibson experienced record low rainfall in 2023 and temperatures up to 4°C above average. At Paruna, moderate to severe drought impacts were recorded on vegetation at >40% of sites (24% moderate, 19% severe; Supplementary Figs S2–S5). The most severe drought impacts were recorded in habitat types on shallow soils and steep slopes (granite, shrubland and wandoo), with affected sites found most frequently on the upper slopes of north- and north-east-facing hillsides (Fig. 4). Approximately 20% (17/84) of sites showed moderate impacts and 14% (12/84) showed severe impacts to the tree layer, with trees worst affected at the granite and shrubland sites (Table 1). Many of these sites received the maximum drought impact score, indicating complete crown dieback or severe stress across the tree layer. In contrast, trees in the jarrah, cleared/revegetation, sheoak-jam and powderbark habitat types were largely unaffected by the drought.
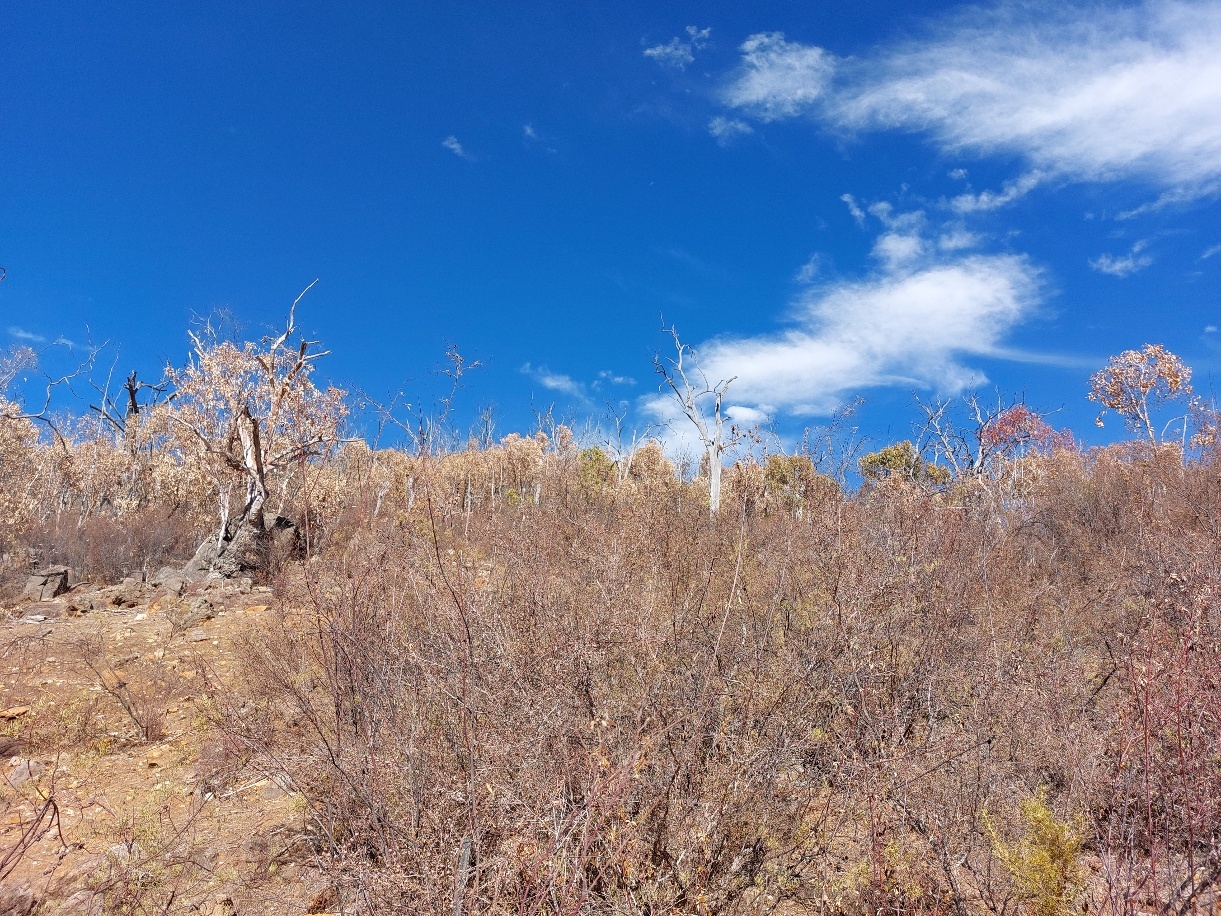
The shrub layer showed similar patterns in drought impacts to the tree layer in 2024. Fifteen sites had no observable shrub layer in the photographs and were excluded from the analysis. Approximately 32% (22/69) of the remaining sites showed moderate impacts and 15% (10/69) showed severe impacts to the shrub layer, with granite and shrubland sites the worst affected on average (Table 1).
Moderate to large declines in fauna population trends were recorded in 12 of 19 site-species combinations (Table 2). One species, the Greater Stick-nest Rat Leporillus conditor, declined to functional extinction (Bannerman et al. 2026). Two species showed large increases. The authors of the sanctuary reports suggested that Western Quolls Dasyurus geoffroii may have benefitted from scavenging animals that died during the drought (Hungerford et al. 2025), while the apparent increase in Shark Bay Mouse Pseudomys gouldii on Faure may have reflected suboptimal survey conditions in the pre-drought survey (Palmer et al. 2025b).
Discussion
Droughts and heatwaves have increased in frequency, intensity and duration in Australia over the last 40 years (Wasko et al. 2021; Trancoso et al. 2020). The annual hot drought record for WA shows strong interannual variability, with substantial events in both earlier and recent decades. The largest annual extents occurred in 2019 and 2024, but mean annual area in 2005–2024 and 1985–2024 did not differ significantly from earlier years. The 1935–1980 interval also contained several large events and did not differ significantly from 2005–2024. These results do not support describing recent decades as statistically unprecedented in annual area affected. Nevertheless, the substantially greater mean extent observed in recent decades warrants attention, particularly given the high interannual variability in the historical record.
The severe hot drought during the 2023–24 summer affected large areas of Paruna, particularly vegetation types on steeper slopes and shallower soils (McGrath et al. 2023). Apparent mortality of trees and shrubs was recorded at ~20% of sites. Substantial declines in threatened and reintroduced fauna were also reported across the four AWC sanctuaries in southwest WA. Many of the native Australian mammal species reported here are known to be sensitive to extreme heat and drought. For example, mortalities in translocated Greater Stick-nest Rats have been attributed to heat stress and dehydration (Short et al. 2019), island populations of Banded Hare-wallabies may decline substantially during droughts (White et al. 2020), and bettong populations can decline during prolonged drought (Short & Turner 1999). Similar vegetation die-off and fauna declines have been reported elsewhere (Rey et al. 2017; Bourne et al. 2020; Pattinson et al. 2022; McGrath et al. 2023; Matusick et al. 2024). The fauna comparisons presented here are observational and should not be interpreted as controlled tests of drought effects.
The largest annual hot drought in this analysis occurred in 2019, followed by 2024. These recent events were exceptional in spatial extent, but the period analyses did not show that mean annual area affected over the most recent two or four decades was significantly greater than in earlier years. Large events also occurred during the mid-twentieth century. The climate analysis measures the spatial extent of threshold exceedance rather than ecological severity, and uncertainty is greater in the early part of the gridded record. Continued monitoring is therefore important because individual hot drought events can affect very large areas and coincide with substantial ecological change. Given the potential for hot droughts to substantially impact on natural systems, natural resource managers must prepare for managing and adapting to hot drought conditions.
ACKNOWLEDGEMENTS
We acknowledge and pay respect to the Whadjuk people of the Noongar Nation, the Traditional Owners and Custodians of the Country upon which this work was undertaken. Fieldwork was approved by the Western Australian Government’s Department of Biodiversity, Conservation and Attractions (DBCA) and the Department of Primary Industries and Regional Development (DPIRD) and conducted under DBCA Animal Ethics Committee permit numbers 2016-07, 2016-41 and 2019-39A and DPIRD Wildlife Animal Ethics Committee permit number 23-02-19. We thank Dr John Kanowski and Dr Jennifer Pierson for their helpful comments on earlier drafts, reviewers for their valuable suggestions which improved the manuscript, and previous and current AWC staff and volunteers for their contributions, with special acknowledgement of Dr Michael Smith, Joshua Hungerford, Dr Louis O’Neill, Georgina Anderson and Dr Sophia Callander. The work would not have been possible without the generous contributions of Australian Wildlife Conservancy supporters. This project was also supported by DPIRD, through funding from the Australian Government’s Future Drought Fund.